ISIS Application Documentation
histeq | Standard View | TOC | Home |
Apply histogram equalization to a cube.
Description
Categories
Groups
Examples
History
Description
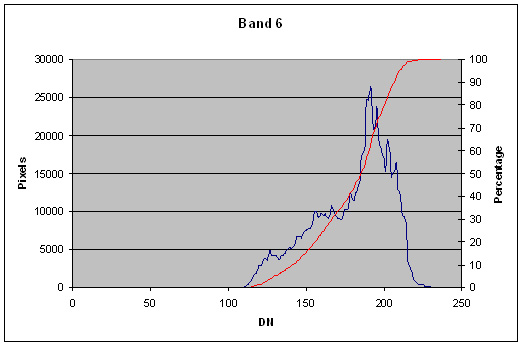
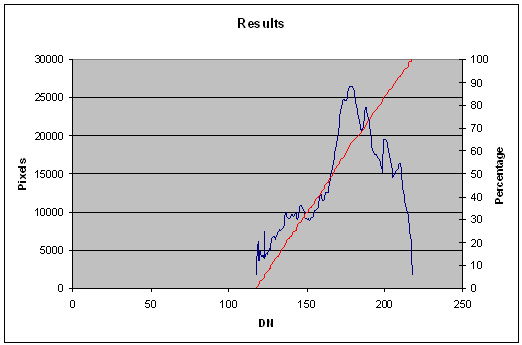
By equalizing the input file's histogram, the resulting cumulative distribution becomes linear instead of curved. The following is an illustration of what happens to an input file. The blue line represents the histogram and the red line is the cumulative distribution. On the left is the histogram and cumulative distribution of an unmodified image, while the figure on the right shows how the both the histogram and distribution are altered.


The blue line represents the input file's histogram and the red line represents its cumulative distribution function.
Categories
Related Objects and Documents
Applications
Parameter Groups
Files
| Name | Description |
|---|---|
| FROM | Input file to be equalized |
| TO | Output cube |
Histogram Options
| Name | Description |
|---|---|
| MINPER | Minimum percentage |
| MAXPER | Maximum percentage |
| INCREMENT | Percentage increment |
Files: FROM
Description
This file will have its cumulative distribution reshaped to be more linear.
| Type | cube |
|---|---|
| File Mode | input |
| Filter | *.cub |
Files: TO
Description
The resultant cube containing a linearized image
| Type | cube |
|---|---|
| File Mode | output |
| Filter | *.cub |
Histogram Options: MINPER
Description
Minimum DN cut-off value at the cumulative percent of the histogram
| Type | double |
|---|---|
| Default | 0.5 |
| Minimum | 0.0 (inclusive) |
| Less Than |
|
Histogram Options: MAXPER
Description
Maximum DN cut-off value at the cumulative percent of the histogram
| Type | double |
|---|---|
| Default | 99.5 |
| Maximum | 100.0 (inclusive) |
Histogram Options: INCREMENT
Description
Percentage increment for the histogram
| Type | integer |
|---|---|
| Default | 1 |
| Minimum | 1 (inclusive) |
| Less Than |
|
Examples
Example 1
Histogram equalization
Description
Command Line
GUI Screenshot
|
Histeq Gui
|
Example Gui Screenshot of GUI with parameters filled in to perform a histogram equalization operation with the input image. |
Input Images
|
Input Peaks (band 6) Image
|
Input image for histeq
Parameter Name:
FROM This is band 6 of the input image for this example. |
|
Input Peaks (band 6) Image
|
Band 6 histogram This is the input image's cumulative distribution for band 6. |
Output Images
|
Output image showing the result of the histogram equalization.
|
Output image for histogram equalization
Parameter Name:
TO This is the output image that results. |
|
Output image
|
Resulting cumulative distribution This is the output image's cumulative distribution. |
History
| Sean Crosby | 2006-12-15 | Original version |
| Steven Lambright | 2008-05-06 | Histogram object no longer has SetRange, updated to use SetValidRange |
| Steven Lambright | 2008-05-13 | Removed references to CubeInfo |
| Tyler Wilson | 2015-09-03 | Commented out a call to Histogram::SetValidRange(min,max) Because of changes made to the Histogram class. See Ref. #2188. |