ISIS Application Documentation
mapgrid | Printer Friendly View | TOC | Home |
Produces a user defined cartographic graticule (latitude/longitude grid) in GML form.
| Overview | Parameters | Example 1 | Example 2 |
Parameter GroupsFiles
Options
|
Files: MAPFILE
Description
This file contains map projection information necessary to produce the grid. This can be a conventional or user defined ISIS mapping template or an existing projected ISIS cube.
| Type | filename |
|---|---|
| File Mode | input |
| Filter | *.map *.cub *.txt |
Files: TO
Description
The resultant GML file. This output file contains drawing instruction in GML form and can be viewed or plotted by various applications such as QGIS, Snowflake GML Viewer, GAIA, etc. In addition, GML files produced via this program can be manipulated by GDAL utilities for conversion to other usable formats. For example, the "ogr2ogr" utility can produce DXF and ESRI Shape files readable by Adobe Illustrator and Arc applications respectively.
| Type | filename |
|---|---|
| File Mode | output |
| Filter | *.gml |
Options: STARTLAT
Description
This defines the minimum or starting latitude to which longitude grid lines will extend.
| Type | double |
|---|
Options: STARTLON
Description
This defines the minimum or starting longitude to which latitude grid lines will extend.
| Type | double |
|---|
Options: ENDLAT
Description
This defines the maximum or ending latitude to which longitude grid lines will extend.
| Type | double |
|---|
Options: ENDLON
Description
This defines the maximum or ending longitude to which latitude grid lines will extend.
| Type | double |
|---|
Options: LATSPACING
Description
This value defines the spacing of latitude lines, starting with STARTLAT
| Type | double |
|---|---|
| Default | 10.0 |
Options: LONSPACING
Description
This value defines the spacing of longitude lines, starting with STARTLON
| Type | double |
|---|---|
| Default | 10.0 |
Options: LATINCREMENT
Description
This value sets the incremental definition of latitude lines. That is, it defines the frequency of how often a coordinate is calculated while drawing each latitude line. In general, a larger value will result in a more rough or jagged line, while a smaller value will result in a more smooth or curved line.
| Type | double |
|---|---|
| Default | 0.01 |
Options: LONINCREMENT
Description
This value sets the incremental definition of longitude lines. That is, it defines the frequency of how often a coordinate is calculated while drawing each longitude line. In general, a larger value will result in a more rough or jagged line, while a smaller value will result in a more smooth or curved line.
| Type | double |
|---|---|
| Default | 0.01 |
Options: BOUNDED
Description
This option will draw a rectangular box outlining the x-y extents of the entire grid.
| Type | boolean |
|---|---|
| Default | TRUE |
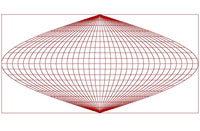
Example 1Sinusoidal Map Grid Description
This example shows the qgis display of a sinusoidal projection created by this application.
The following mapfile was used in the mapgrid application to create the grid.
Group = Mapping
  ProjectionName     = Sinusoidal
  TargetName         = MARS
  EquatorialRadius   = 3396190.0 <meters>
  PolarRadius        = 3376200.0 <meters>
  LatitudeType       = Planetocentric
  LongitudeDirection = PositiveEast
  LongitudeDomain    = 360
  CenterLongitude    = 180.0
End_Group
End
Command Line
mapgrid mapfile=mapFile1.txt startlat=-90 endlat=90 startlon=0 endlon=360 to=sinuGrid.txt
Create a sinusoidal projection map grid.
Output Image
|
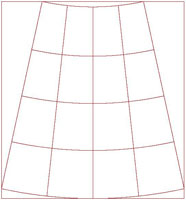
Example 2Lambert Confromal Map Grid Description
This example shows the qgis display of a lambert conformal projection created by this application.
The following mapfile was used in the this application to create the grid.
Group = Mapping
  ProjectionName         = LambertConformal
  TargetName             = MARS
  EquatorialRadius       = 3396190.0 <meters>
  PolarRadius            = 3376200.0 <meters>
  LatitudeType           = Planetocentric
  LongitudeDirection     = PositiveEast
  LongitudeDomain        = 360
  CenterLongitude        = 20.0
  CenterLatitude         = 40.0
  FirstStandardParallel  = 32.0
  SecondStandardParallel = 43.0
End_Group
End
Command Line
mapgrid mapfile=mapFile2.txt startlat=20 endlat=60 startlon=0 endlon=40 to=lambGrid.txt
Create a lambert conformal projection map grid.
Output Image
|