This program applies a spectral high pass filter to a cube. The spectral
component means that this will be a high pass amongst the bands of an image
as opposed to averaging the lines and samples on the spacial plane with high
pass. A highpass filter involves subtracting a lowpass, the average, from
the original value.
This is the total number of bands in the boxcar. It must be odd and
can not exceed twice the number of bands in the cube. In general, the
size of the boxcar does not cause the program to operate significantly
slower.
Valid minimum pixel value that will be used in boxcar computation. If
a pixel value is less than LOW then it will not be used when computing
the average.
Valid maximum pixel value that will be used in boxcar computation. If
a pixel value is greater than HIGH then it will not be used when
computing the average.
This example shows a spectral highpass filter being applied to the image
with a 15 depth boxcar. This cube has 256 bands so 15 is relatively
small. Although no averaging is done within a single band, the averaging
of the pixels of many bands will cause some averaging and smoothing of
the image if there is much difference between bands. Here is an image
which highlights which pixels a single pass would average. The image
shows a 9x9 dot instead of a single pixel highlighted to make it more
visible. In this picture the boxcar would be seven or more bands, with
the output pixel being one of the visible pixels. Depending on how large
the boxcar was many of the values taken in could not be original, at a
minimum, one value will be mirrored since there are only six available
bands.
This example will filter the image using 15 bands and no limits on
high or low.
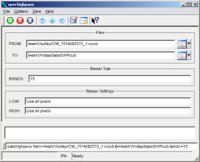
GUI Screenshot
spechighpass gui
Example GUI
Screenshot of the GUI with parameters set to perform the
spechighpass filter with a 15 band boxcar on the image
CM_1514302573_1.ir.cub.
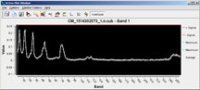
Input Image
The image graph before the filter
Input image spectral graph before spechighpass filter
Parameter Name:
FROM
This is the spectral plot of the center point of the image, (32,
32), and shows all bands, 1- 256. No averaging has been applied,
this is clear partialy because of th extreme peaks visible in the
first half. The peaks are related to values which differ
significantly from the bands around them.
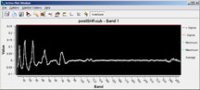
Output Image
The image graph after the filter
Output image spectral graph after being filtered
Parameter Name:
TO
This is the image after the filter. Although there are still sharp
peaks, everything has been brought closer to zero. In the before
image nearly all values are above zero, now the values are on either
side of zero and are smaller.
Example 2
Example of usage of the spectral highpass filter.
Description
In this example the spechighpass filter is used to filter an image using
a boxcar of size 63 and a high tolerance of .075 on a photo with 256
bands.
This example will filter the image using 63 bands and a high limit of
0.075.
GUI Screenshot
spechighpass gui
Example GUI
Screenshot of the GUI with parameters set to perform the
spechighpass filter with a 63 band boxcar on the image
CM_1516302573_1.ir.cub.
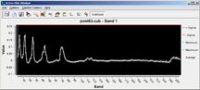
Input Image
The image graph before the filter
Input image spectral graph before spechighpass filter
Parameter Name:
FROM
This is the spectral graph of the input image at location (32, 32),
notice the sharp peaks and all values greater than zero.
Output Image
The image graph after the filter
Output image after being filtered
Parameter Name:
TO
In this image the differences is that everything has been lowered
except for the values already at zero. Some values which were
positive are now negative as well.