

grid
Add a graticule or rectangular grid to the input image
Two types of grids are available:
1. A graticule based on latitude and longitude coordinates where (MODE=GROUND).Defaults:
2. A simple rectangular grid based on line and sample coordinates where (MODE=IMAGE).
- MODE = GROUND
- BASELAT = 0.0
- BASELON = 0.0
- LATINC = 10
- LONINC = 10
The grid pattern will intersect a specific origin of either (latitude,longitude) or (sample,line) position. Grid lines are drawn at intervals from the origin based on the increment values defined by the user. The graticule produced may not match the image coordinates exactly, so the result will have outer grid cells that might have different heights and widths than the interior grid cells. In addition, if the LATINC and LONINC are too large compared with your image map scale, the grid lines may miss your image. If the increments are too small, the grid lines may be overly dense.
This application will draw grids on either ISIS level0, level1 (with successful spiceinit), and level2 cubes, or mosaics. The mapping information in the labels will be used to draw grid lines on mosaics and Level2 images. If the latitude and longitude information cannot be calculated or extracted using the image label contents, then use the IMAGE mode.
For Cubes with an associated band-dependent camera model (latitude, longitude coordinates do not correspond to the same sample, line coordinates in each band,) the grid is recalculated for each band.
Example Parameter Settings for Grids:
Example 1: Superimpose a basic latitude/longitude graticule with grid lines drawn every 10 degrees based on zero:
MODE=GROUND BASELAT=0 BASELON=0 LATINC=10 LONINC=10
Example 2: Superimpose a graticule on an input image that intersects at line 23 and sample 17, with vertical lines drawn every 30 pixels and horizontal lines every 40 pixels:
MODE=IMAGE BASELINE=23 BASESAMPLE=17 SINC=30 LINC=40
Note: MODE=GROUND cannot be used when sample and line coordinates are used.
Example 3: Superimpose a latitude/longitude graticule with a grid intersection at -5.0 degree latitude and 140.0 degree longitude, with latitude lines drawn every 2.5 degrees and longitude lines drawn every 3 degrees:
MODE=GROUND BASELAT=-5.0 BASELON=140 LATINC=2.5 LONINC=3
Example 4: Superimpose a latitude/longitude graticule within a subarea of an image (full latitude and longitude extent), with a grid line drawn every 2.5 degrees between latitudes -8 and -1 degrees and only between longitudes 140 and 145 degrees:
MODE=GROUND BASELAT=0 BASELON=0 LATINC=2.5 LONINC=2.5 MINLAT=-8 MAXLAT=-1 MINLON=140 MAXLON=145 Bound=yes
For complex grids, the grid application can be run multiple times with different parameter settings for each successive run that builds onto the previous output file. The TICKS option can be used to draw short ticks instead of grid lines. The OUTLINE option will draw grid lines along the outside edges of the first and last samples and lines of the input file. The BOUNDARY option will either draw grid lines around the outside edges of the input file or around the bounding box specified by the user with MINLAT, MAXLAT, MINLON, and MAXLON parameters.
Categories
Related Objects and Documents
Applications
History
| Sean Crosby | 2007-03-16 | Original version |
| Steven Lambright | 2007-07-27 | Added category: Map Projection |
| Steven Lambright | 2008-04-22 | Fixed problems with mapping outside of the projection space and with 0lat/0lon boundaries. |
| Steven Lambright | 2008-05-12 | Removed references to CubeInfo |
| Steven Lambright | 2008-06-12 | Added outline option |
| Steven Lambright | 2009-01-06 | Changed how mode=ground works |
| Steven Lambright | 2010-05-06 | Added TICKS options |
| Steven Lambright | 2010-07-22 | Added LINEWIDTH option |
| Mackenzie Boyd | 2011-01-21 | Added more line options, to change output to be HRS, LRS, NULL, or a DN. |
| Steven Lambright | 2011-01-25 | Bug fixes for projections that use PositiveWest or Planetographic coordinate systems. The BASELAT and BASELON parameters are now expected to be in the units of the projection (if your cube has a planetographic latitude system, and baselat=50, then there will be a line at the planetographic latitude of 50). |
| Steven Lambright | 2011-01-26 | Added BOUNDARY, MINLAT, MAXLAT, MINLON and MAXLON options. |
| Steven Lambright | 2011-12-08 | Fixed a bug with the outline option. If the image had a larger number of samples than number of lines, all of the data at sample > number of lines would be considered a grid line. This could result in a large portion of the image losing legitimate DN values for the grid value. Fixes #607. |
| Steven Lambright | 2012-01-04 | Tested and documented for the January 2012 release. The documentation updates included were recommended by Chris Isbell. |
| Adam Licht | 2012-12-26 | Added functionality to choose the source of image background. Pixel Values for behind the grid can now be the image pixel value, HRS, LRS, NULL, or a DN. |
| Steven Lambright | 2012-12-31 | Incorporated Adam Licht's changes into Isis. This included re-formatting to match current Isis 3 coding standards, removal of error checking of conditions that cannot happen, fixes with running in batch mode/resetting of variable states between runs, some re-positioning of parameter locations, and creating tests. These changes shouldn't break any existing scripts that utilize grid. Fixes #917. |
| Moses Milazzo | 2013-03-24 | Added to documentation to alert the user to the fact that providing a poorly chosen starting point or grid increment may result in unexpected behavior. Fixes #178. |
| Ella Mae Lee | 2013-07-18 | Updated the documentation and added examples. Fixes #178. |
| Janet Barrett | 2014-06-23 | Modified so that the output cube characteristics are obtained from the input cube and/or cube characteristics specified on the command line. Fixes #2063. |
| Kristin Berry | 2014-11-25 | Modified to work on Cubes with associated band-dependent camera models. Now when MODE="GROUND" on a Cube with a band-dependent camera model, the grid will be re-calculated for each band. Fixes #2191. |
| Kristin Berry | 2017-02-16 | Fixed error introduced in last change which caused grid to no longer work on multi-band cubes without camera models (for example: a mosaic will not have a camera model.) Fixes #4586. |
| Jesse Mapel | 2017-06-26 | Added a flag to extend the grid past the longitude domain boundary. Fixes #2185. |
| Kaitlyn Lee | 2020-10-26 | Converted application and tests for Gtest conversion. |
Parameters
Files
| Type | cube |
|---|---|
| File Mode | input |
| Filter | *.cub |
| Type | cube |
|---|---|
| File Mode | output |
| Filter | *.cub |
Grid Type
| Type | string | |||||||||
|---|---|---|---|---|---|---|---|---|---|---|
| Default | GROUND | |||||||||
| Option List: |
|
| Type | boolean |
|---|---|
| Default | false |
| Inclusions |
|
| Type | boolean |
|---|---|
| Default | false |
| Type | boolean |
|---|---|
| Default | false |
| Type | boolean |
|---|---|
| Default | false |
Image Grid Parameters
| Type | integer |
|---|---|
| Default | 1 |
| Minimum | 1 (inclusive) |
| Type | integer |
|---|---|
| Default | 1 |
| Minimum | 1 (inclusive) |
| Type | integer |
|---|---|
| Default | 100 |
| Minimum | 1 (inclusive) |
| Type | integer |
|---|---|
| Default | 100 |
| Minimum | 1 (inclusive) |
Ground Grid Parameters
| Type | double |
|---|---|
| Default | 0.0 |
| Minimum | -90.0 (inclusive) |
| Type | double |
|---|---|
| Default | 0.0 |
| Minimum | -360.0 (inclusive) |
| Type | double |
|---|---|
| Default | 10.0 |
| Minimum | 0.0 (inclusive) |
| Type | double |
|---|---|
| Default | 10.0 |
| Minimum | 0.0 (inclusive) |
Ground Grid Limits
| Type | double |
|---|---|
| Internal Default | Automatic |
| Minimum | -90 (inclusive) |
| Maximum | 90 (inclusive) |
| Type | double |
|---|---|
| Internal Default | Automatic |
| Minimum | -90 (inclusive) |
| Maximum | 90 (inclusive) |
| Greater Than | MINLAT |
| Type | double |
|---|---|
| Internal Default | Automatic |
| Minimum | -360 (inclusive) |
| Maximum | 360 (inclusive) |
| Type | double |
|---|---|
| Internal Default | Automatic |
| Minimum | -360 (inclusive) |
| Maximum | 360 (inclusive) |
| Greater Than | MINLON |
Line Parameters
| Type | integer |
|---|---|
| Default | 1 |
| Minimum | 1 (inclusive) |
| Odd | This value must be an odd number |
| Type | string | |||||||||||||||
|---|---|---|---|---|---|---|---|---|---|---|---|---|---|---|---|---|
| Default | HRS | |||||||||||||||
| Option List: |
|
| Type | double |
|---|
Background Type
| Type | string | ||||||||||||||||||
|---|---|---|---|---|---|---|---|---|---|---|---|---|---|---|---|---|---|---|---|
| Default | IMAGE | ||||||||||||||||||
| Option List: |
|
| Type | double |
|---|
Tick Parameters
| Type | boolean |
|---|---|
| Default | false |
| Type | integer |
|---|---|
| Default | 5 |
| Minimum | 1 (inclusive) |
| Odd | This value must be an odd number |
Example 1
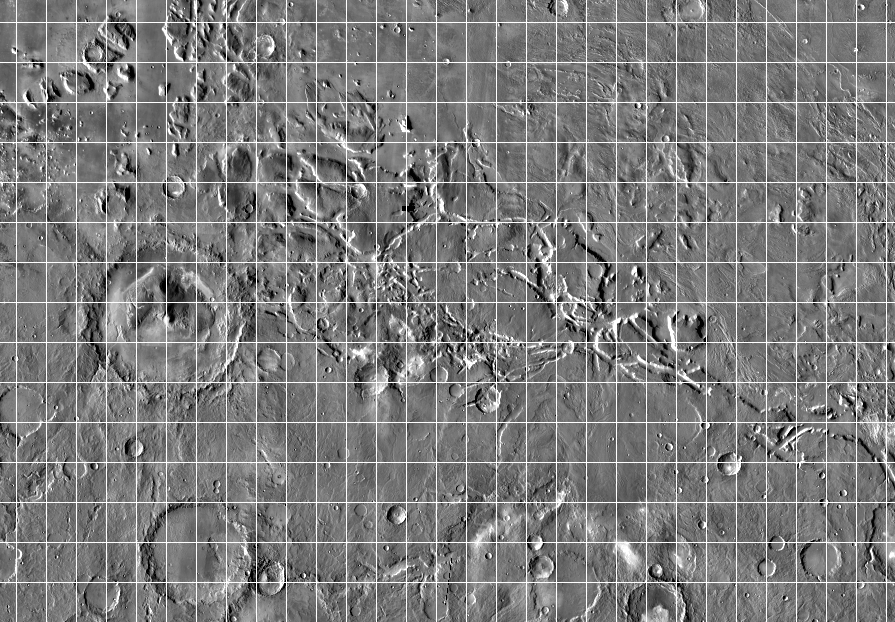
Basic latitude/longitude graticule
Command Line
grid
          from=aeolis_reduced.cub to=grid_ex1.cub
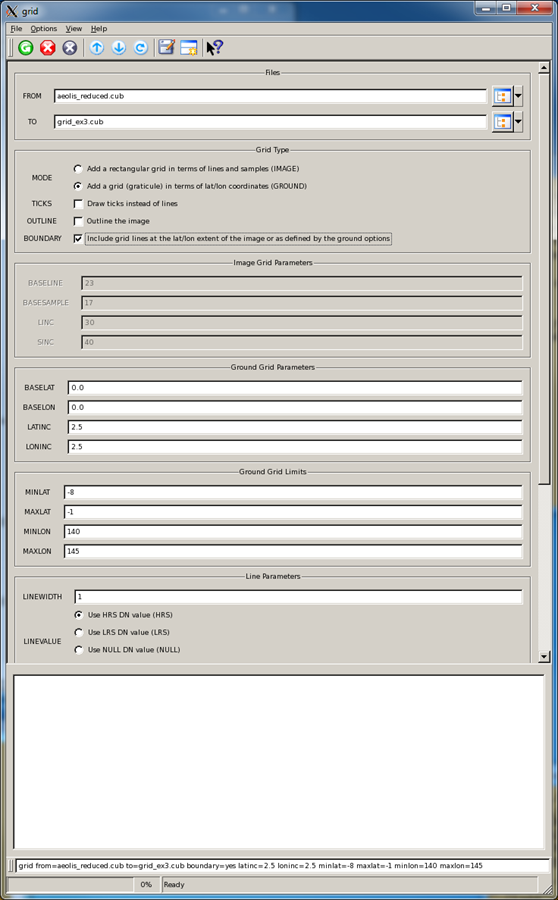
GUI Screenshot
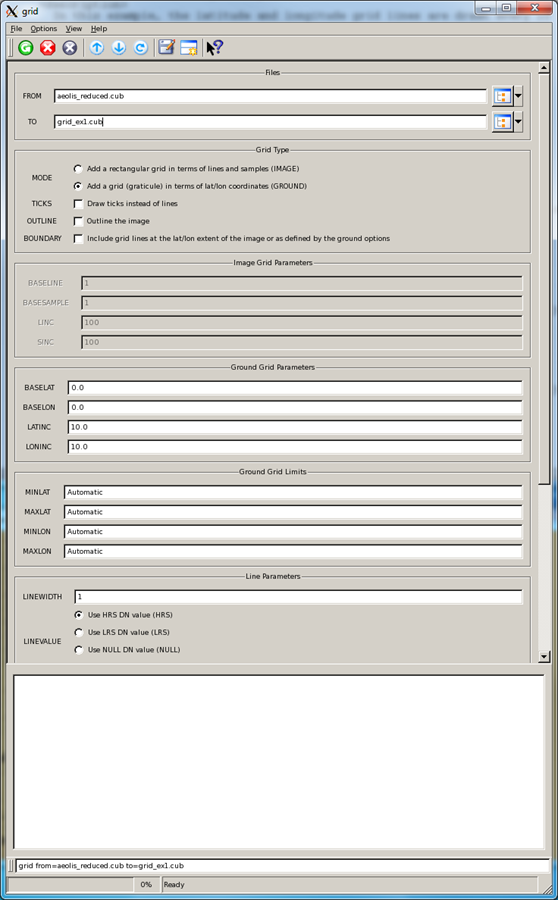
Example GUI
Grid GUIScreenshot of GUI with default parameters.
Input Image
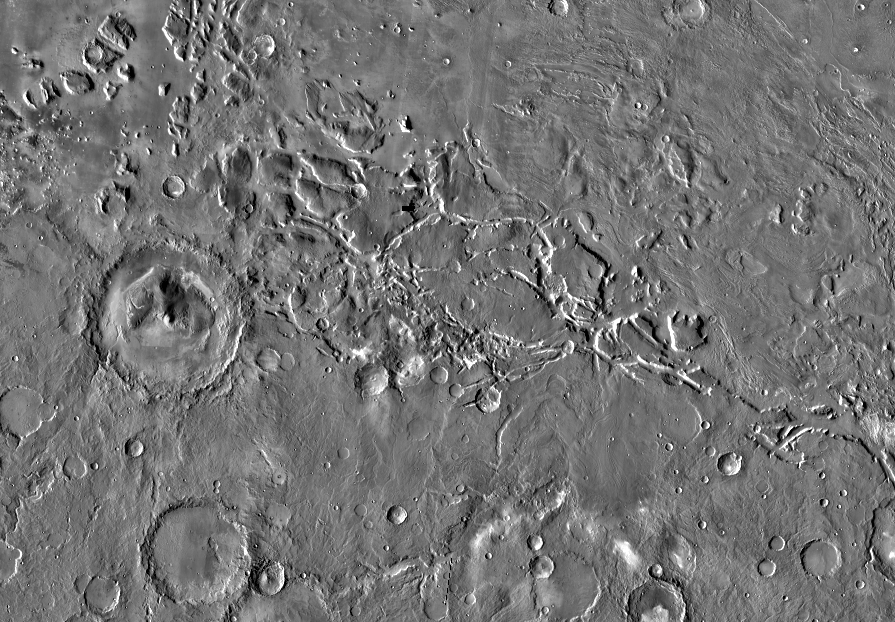
Input file
Input image
Parameter Name:
From
This is the ungridded input image.
Output Image
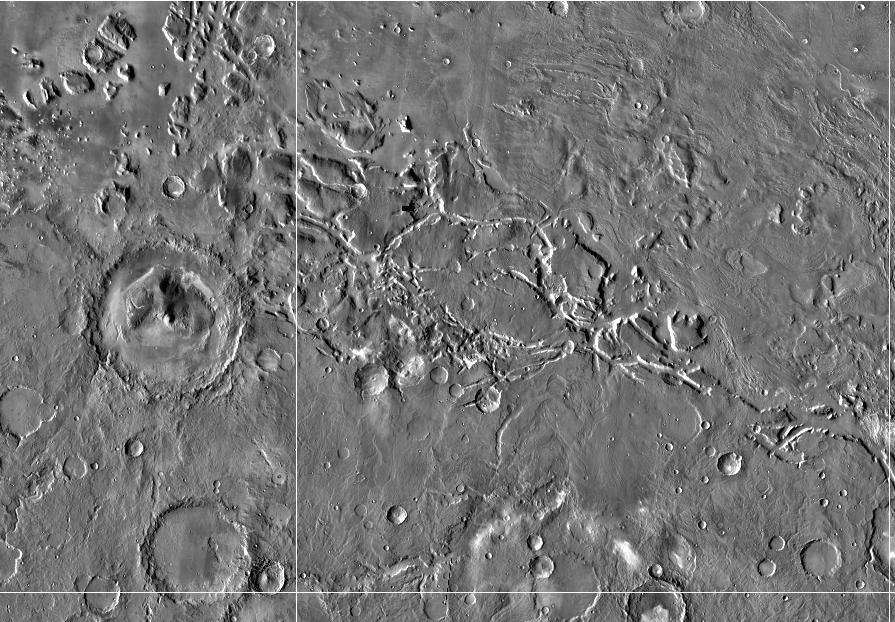
Gridded output file
Gridded output image
Parameter Name:
TO
This file is gridded every 10 degrees in latitude and longitude starting at 0.0 degree latitude and longitude.
Example 2
Simple rectangular grid
Command Line
grid
          from=aeolis_reduced.cub to=grid_ex2.cub mode=image baseline=23 basesamp=17 sinc=30 linc=40
GUI Screenshot
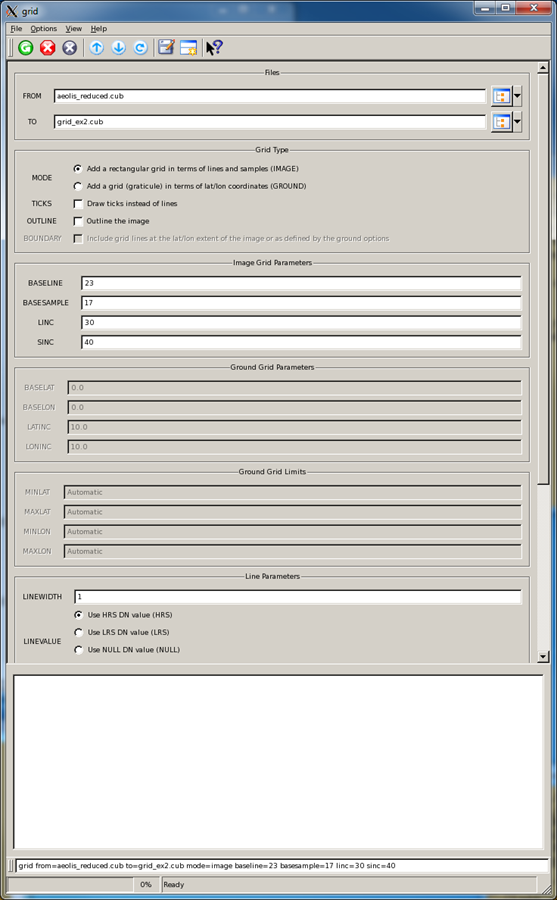
Example GUI
Grid GUIScreenshot of GUI with parameter settings defined by the user.
Input Image
Input file
Input image
Parameter Name:
From
This is the ungridded input image.
Output Image
Output file
Gridded output image
Parameter Name:
TO
The grid lines intersect at line 23 and sample 17, with vertical lines drawn every 30 pixels and horizontal lines every 40 pixels outward from the origin.
Example 3
Insert a graticule within the input image
Command Line
grid
          from=aeolis_reduced.cub to=grid_ex4.cub mode=ground baselat=0 baselon=0 latinc=2.5
	  loninc=2.5 minlat=-8 maxlat=-1 minlon=140 maxlon=145 bound=yes
GUI Screenshot
Example GUI
Grid GUIScreenshot of GUI with parameter settings defined by the user.
Input Image
Input file
Input image
Parameter Name:
From
This is the ungridded input image.
Output Images
Output file
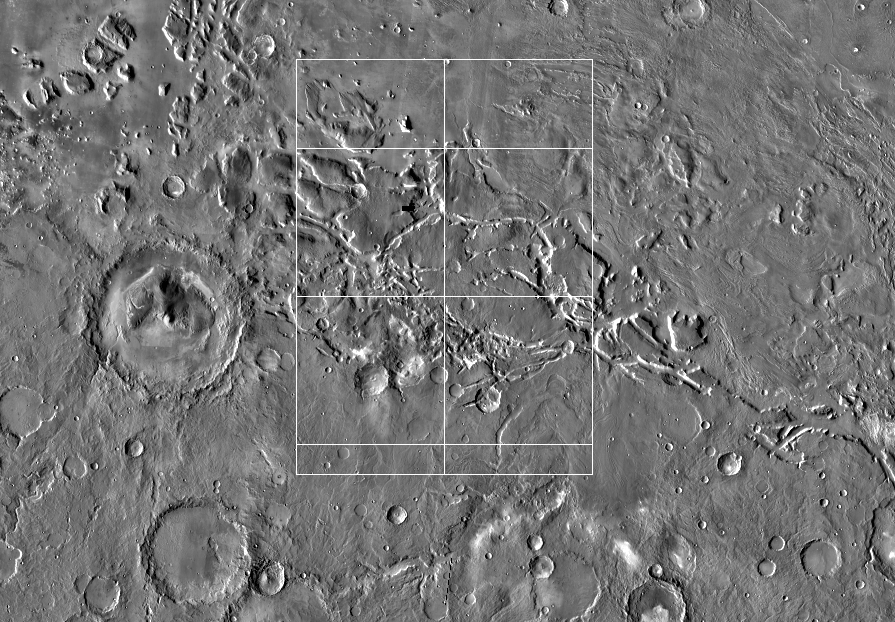
Gridded output image using BOUND=YES
Parameter Name:
TO
The grid lines intersect at 0.0 degree latitude and longitude, and increments every 2.5 degrees in latitude and longitude. The outer edges of the bounding box around the minimum and maximum extents are gridded (BOUND=YES).
Second output file using BOUND=NO
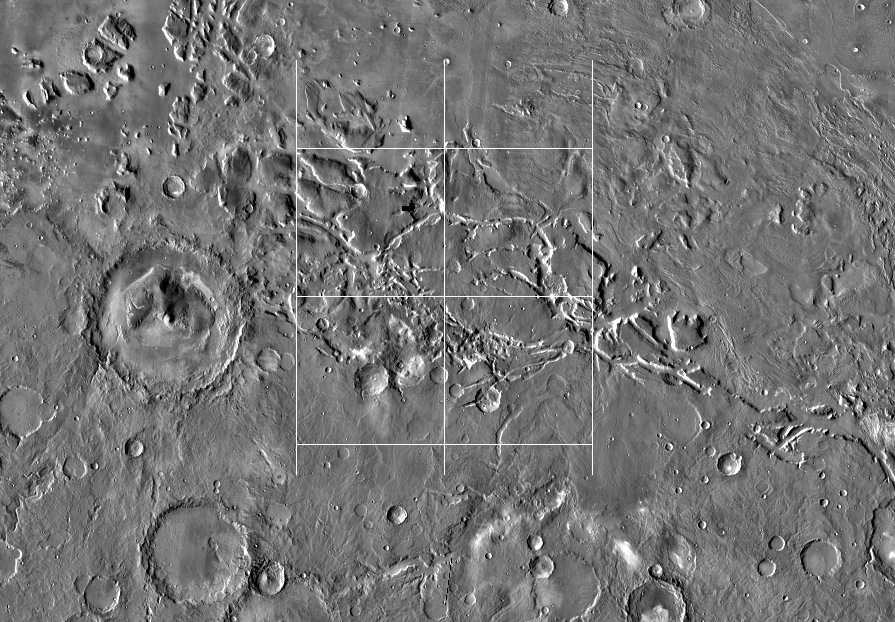
Gridded output image using BOUND=NO
Parameter Name:
TO
The grid lines intersect at 0.0 degree latitude and longitude, and increments
every 2.5 degrees in latitude and longitude. The outer edges of the
bounding box are not gridded (BOUND=NO).
Command line:
grid from=aeolis_reduced.cub to=grid_ex4b.cub mode=ground baselat=0 baselon=0 latinc=2.5
loninc=2.5 minlat=-8 maxlat=-1 minlon=140 maxlon=145 bound=no