

mapgrid
Produces a user defined cartographic graticule (latitude/longitude grid) in GML form.
This application will create a GML (Geography Mapping Language) file
containing drawing instruction for a user defined latitude/longitude
graticule (grid). The MAPFILE provides definition of map projection
parameters while user input 'Options' define how specific latitude and lines
are drawn. The resulting GML file can be viewed by various applications such
as QGIS, Snowflake GML Viewer, GAIA, etc. In addition, GML files produced
via this program can be manipulated by GDAL utilities for conversion to
other usable formats. For example, the "ogr2ogr" utility can produce DXF and
ESRI Shape files readable by Adobe Illustrator and Arc applications
respectively.
Categories
History
| Elizabeth Ribelin | 2005-09-06 | Original version |
| Brendan George | 2005-11-01 | Fixed application test for all systems |
| Elizabeth Miler | 2005-11-03 | Fixed bug in xml and made appTest test larger lat/lon increments and spacings to reduce the size of truth files |
| Elizabeth Miller | 2005-11-29 | Modified mapgrid so the boundary lat lines will always be drawn |
| Elizabeth Miller | 2006-05-18 | Depricated CubeProjection and ProjectionManager to ProjectionFactory |
| Steven Lambright | 2007-06-21 | Changed output to be in GML format, fixed bug with bounded option |
| Steven Lambright | 2007-07-17 | Fixed bug with include files. |
| Travis Addair | 2009-08-10 | Mapping group parameters are now placed into the print file. |
| Steven Lambright | 2012-01-05 | Tested and documented for the January 2012 release. The documentation updates included were recommended by Chris Isbell. |
| Debbie A. Cook | 2012-12-06 | Changed to use TProjection instead of Projection. References #775 |
Parameters
Files
This file contains map projection information necessary to produce the
grid. This can be a conventional or user defined ISIS mapping
template or an existing projected ISIS cube.
| Type | filename |
|---|---|
| File Mode | input |
| Filter | *.map *.cub *.txt |
The resultant GML file. This output file contains drawing instruction
in GML form and can be viewed or plotted by various applications such
as QGIS, Snowflake GML Viewer, GAIA, etc. In addition, GML files
produced via this program can be manipulated by GDAL utilities for
conversion to other usable formats. For example, the "ogr2ogr" utility
can produce DXF and ESRI Shape files readable by Adobe Illustrator and
Arc applications respectively.
| Type | filename |
|---|---|
| File Mode | output |
| Filter | *.gml |
Options
This defines the minimum or starting latitude to which longitude grid
lines will extend.
| Type | double |
|---|
This defines the minimum or starting longitude to which latitude grid
lines will extend.
| Type | double |
|---|
This defines the maximum or ending latitude to which longitude grid
lines will extend.
| Type | double |
|---|
This defines the maximum or ending longitude to which latitude grid
lines will extend.
| Type | double |
|---|
This value defines the spacing of latitude lines, starting with STARTLAT
| Type | double |
|---|---|
| Default | 10.0 |
This value defines the spacing of longitude lines, starting with STARTLON
| Type | double |
|---|---|
| Default | 10.0 |
This value sets the incremental definition of latitude lines. That
is, it defines the frequency of how often a coordinate is calculated
while drawing each latitude line. In general, a larger value will
result in a more rough or jagged line, while a smaller value will
result in a more smooth or curved line.
| Type | double |
|---|---|
| Default | 0.01 |
This value sets the incremental definition of longitude lines. That
is, it defines the frequency of how often a coordinate is calculated
while drawing each longitude line. In general, a larger value will
result in a more rough or jagged line, while a smaller value will
result in a more smooth or curved line.
| Type | double |
|---|---|
| Default | 0.01 |
This option will draw a rectangular box outlining the x-y extents of the entire grid.
| Type | boolean |
|---|---|
| Default | TRUE |
Example 1
Sinusoidal Map Grid
This example shows the qgis display of a sinusoidal projection created by this application.
The following mapfile was used in the mapgrid application to create the grid.
Group = Mapping
  ProjectionName     = Sinusoidal
  TargetName         = MARS
  EquatorialRadius   = 3396190.0 <meters>
  PolarRadius        = 3376200.0 <meters>
  LatitudeType       = Planetocentric
  LongitudeDirection = PositiveEast
  LongitudeDomain    = 360
  CenterLongitude    = 180.0
End_Group
End
Command Line
Create a sinusoidal projection map grid.
mapgrid mapfile=mapFile1.txt startlat=-90 endlat=90 startlon=0 endlon=360 to=sinuGrid.txt
Output Image
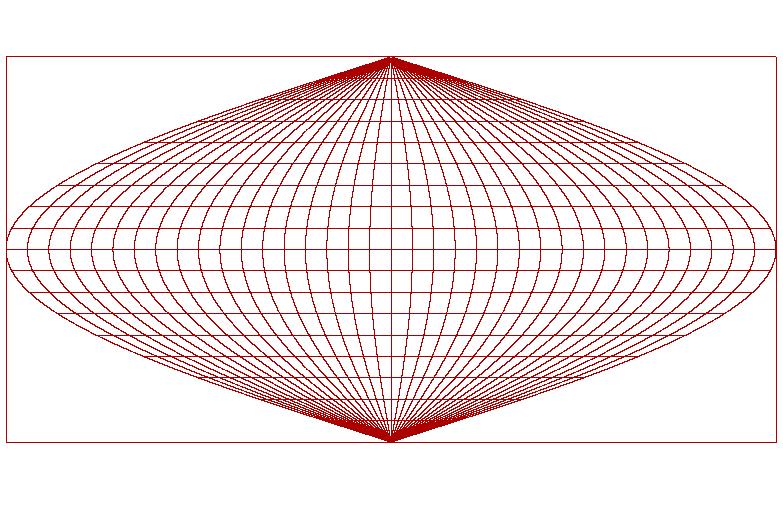
Output image as it appears in qgis for mapgrid
Output image showing the results of the mapgrid application.
Parameter Name:
TO
This is the output image that results.
Example 2
Lambert Confromal Map Grid
This example shows the qgis display of a lambert conformal projection created by this application.
The following mapfile was used in the this application to create the grid.
Group = Mapping
  ProjectionName         = LambertConformal
  TargetName             = MARS
  EquatorialRadius       = 3396190.0 <meters>
  PolarRadius            = 3376200.0 <meters>
  LatitudeType           = Planetocentric
  LongitudeDirection     = PositiveEast
  LongitudeDomain        = 360
  CenterLongitude        = 20.0
  CenterLatitude         = 40.0
  FirstStandardParallel  = 32.0
  SecondStandardParallel = 43.0
End_Group
End
Command Line
Create a lambert conformal projection map grid.
mapgrid mapfile=mapFile2.txt startlat=20 endlat=60 startlon=0 endlon=40 to=lambGrid.txt
Output Image
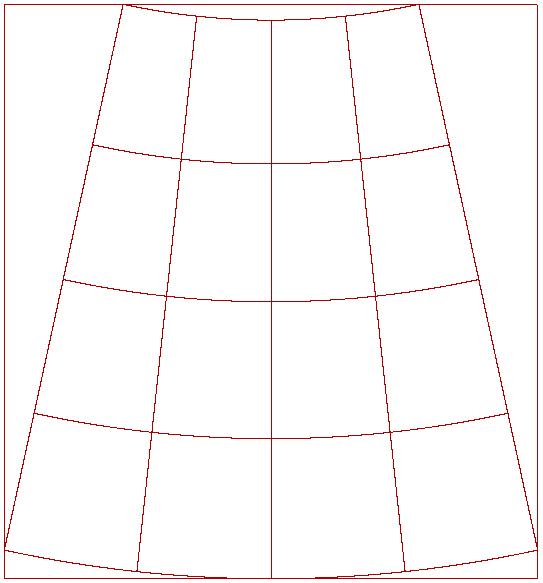
Output image as it appears in qgis
Output image showing the results of the mapgrid application.
Parameter Name:
TO
This is the output image that results