 |
Isis 3 Programmer Reference
|
|
Isis 3 Programmer Reference
|
#include <PlotWindow.h>
Public Types | |
| enum | MenuOptions { ShowHideMarkersMenuOption = 1, ShowHideCurvesMenuOption = 2, ShowTableMenuOption = 4, SaveMenuOption = 8, PrintMenuOption = 16, TrackMenuOption = 32, BackgroundSwitchMenuOption = 64, ShowHideGridMenuOption = 128, RenameLabelsMenuOption = 256, SetDisplayRangeMenuOption = 512, ResetScaleMenuOption = 1024, ClearPlotMenuOption = 2048, DefaultHelpMenuOption = 4096, LineFitMenuOption = 8192, ConfigurePlotMenuOption = 16384, AllMenuOptions } |
| There is a menu option for everything in the plot window's menu. More... | |
Public Slots | |
| void | clearPlot () |
| This method completely clears the plot of all plot items. More... | |
| void | configurePlotCurves () |
| This method creates a CubePlotCurveConfigureDialog object. More... | |
| void | createBestFitLine () |
| This method prompts the user to select the best fit line criterea. More... | |
| void | printPlot () |
| Provides printing support of the plot image. More... | |
| void | changePlotLabels () |
| This method creates the dialog box which allows the user to relabel the plot window. More... | |
| void | savePlot () |
| This method allows the user to save the plot as a png, jpg, or tif image file. More... | |
| void | setDefaultRange () |
| Resets the x/y min/max to the defaults. More... | |
| void | setLabels () |
| Makes the user specified changes to the plot labels. More... | |
| void | setUserValues () |
| This method sets the scale for the axis according to the user specified numbers. More... | |
| void | showHideAllMarkers () |
| Shows/Hides all the markers(symbols) More... | |
| void | showHideAllCurves () |
| This method shows or hides all of the curves in the plotWindow. More... | |
| void | resetScale () |
| Sets plot scale back to the defaults. More... | |
| void | showHideGrid () |
| This method hides/shows the grid on the plotWindow and changes the text for the action. More... | |
| void | showHelp () |
| This method creates and shows the help dialog box for the plot window. More... | |
| void | showTable () |
| This method is called from the showTable action on the tool bar There are some checks done to make sure there are data to fill the table. More... | |
| void | switchBackground () |
| This method toggles the plot background color between black and white. More... | |
| void | trackerEnabled () |
| Enables the plot mouse tracker. More... | |
| void | scheduleFillTable () |
| Fills in the table with the data from the current curves in the plotWindow once all current actions/activations are done. More... | |
| void | fillTable () |
| Fills in the table with the data from the current curves in the plotWindow immediately. More... | |
Signals | |
| void | closed () |
| Emitted when there is a close event on this window that will be accepted. More... | |
| void | plotChanged () |
| Emitted every time there is a change to the plot window. More... | |
| void | requestFillTable () |
Public Member Functions | |
| PlotWindow (QString title, PlotCurve::Units xAxisUnits, PlotCurve::Units yAxisUnits, QWidget *parent, MenuOptions optionsToProvide=AllMenuOptions) | |
| This constructs a plot window. More... | |
| virtual void | add (CubePlotCurve *pc) |
| This method adds the curves to the plot. More... | |
| virtual void | clearPlotCurves () |
| This method also clears the plot of all plot items, but does not call the table delete stuff This method is called from plotTool each time the changePlot() method is called. More... | |
| bool | canAdd (CubePlotCurve *curveToTest) const |
| This method tests whethere or not a CubePlotCurve can be successfully added to this window. More... | |
| QColor | plotBackgroundColor () const |
| Returns the plot's background color. More... | |
| QList< CubePlotCurve * > | plotCurves () |
| Get a comprehensive list of the plot curves inside of this plot window, excluding plot curves that are in the process of being removed. More... | |
| QList< const CubePlotCurve * > | plotCurves () const |
| Get a comprehensive const list of the plot curves inside of this plot window, excluding plot curves that are in the process of being removed. More... | |
| QList< QwtPlotSpectrogram * > | plotSpectrograms () |
| Get a comprehensive list of the scatter plots (spectrograms) inside of this plot window. More... | |
| QList< const QwtPlotSpectrogram * > | plotSpectrograms () const |
| Get a comprehensive const list of the scatter plots (spectrograms) inside of this plot window. More... | |
| QString | plotTitle () const |
| Returns the plot title. More... | |
| bool | userCanAddCurves () const |
| Ask if a user action can add this curve to this window in general. More... | |
| PlotCurve::Units | xAxisUnits () const |
| This is the data-type of the curves' x data in this plot window. More... | |
| PlotCurve::Units | yAxisUnits () const |
| This is the data-type of the curves' y data in this plot window. More... | |
| virtual void | paint (MdiCubeViewport *vp, QPainter *painter) |
| Paint plot curve information onto the viewport. More... | |
| void | replot () |
| Reset the scale of the plot, replot it and emit plot changed. More... | |
| void | setAxisLabel (int axisId, QString title) |
| Sets the plots given axis title to the given string. More... | |
| void | setPlotBackground (QColor c) |
| Sets the plot background color to the given color. More... | |
| void | setPlotTitle (QString pt) |
| Sets the plot title to the given string. More... | |
| void | setUserCanAddCurves (bool) |
| Allow or disallow users from manually putting curves into this plot window through either copy-and-paste or drag-and-drop. More... | |
| void | showWindow () |
| Shows the plot window, and raises it to the front of any overlapping sibling widgets. More... | |
| virtual void | update (MdiCubeViewport *activeViewport) |
| This is provided to allow children to react to tool updates. More... | |
Static Public Member Functions | |
| static QString | defaultWindowTitle () |
| This is the typical suffix for plot windows, it's here in case we want to update all plot windows to have a different ending than just 'Plot' on them (for example, 'Plot Window'). More... | |
| static QString | settingsFileName (QString objectTitle) |
Protected Member Functions | |
| void | createWidgets (MenuOptions optionsToProvide) |
| This method is called by the constructor to create the plot, legend. More... | |
| void | disableAxisAutoScale () |
| This turns off scaling the x/y axes automatically. More... | |
| virtual void | dragEnterEvent (QDragEnterEvent *event) |
| When a user drags data into our plot window, we need to indicate whether or not this data is compatible with this window. More... | |
| virtual void | dropEvent (QDropEvent *event) |
| This is called when a user drops data into our window. More... | |
| virtual bool | eventFilter (QObject *o, QEvent *e) |
| This method filters the events of the objects it is connected to. More... | |
| void | mousePressEvent (QObject *object, QMouseEvent *e) |
| This is a helper method for the eventFilter() method. More... | |
| QwtPlot * | plot () |
| Get the plot encapsulated by this PlotWindow. More... | |
| void | setMenus (QList< QMenu *> menus, QList< QAction *> actions) |
| Sets up the menus added from a parent object. More... | |
| QwtPlotZoomer * | zoomer () |
| Get this window's plot's zoomer. More... | |
| QString | settingsFileName () const |
| virtual void | closeEvent (QCloseEvent *event) |
| This method is overridden so that we can be sure to write the current settings of the Main window. More... | |
| virtual void | readSettings (QSize defaultSize=QSize()) |
| This method ensure that the settings get written even if the Main window was only hidden, not closed. More... | |
Private Slots | |
| void | autoScaleCheckboxToggled () |
| This is a helper method for the set scale configuration dialog. More... | |
| void | onClipboardChanged () |
| This slot will be called when the system clipboard is changed. More... | |
| void | pasteCurve () |
| When the user pastes a curve try to put it into this plot window. More... | |
Private Member Functions | |
| QPair< double, double > | findDataRange (int axisId) const |
| This calculates the data range of the specified axis (works with xBottom and yLeft only). More... | |
| bool | userCanAddCurve (const QMimeData *curve) |
| Ask if a user action can add this curve to this window. More... | |
| void | updateVisibility (PlotCurve *curve) |
| This method sets the visibility states in the curve (and it's symbols) to match with this window's current visibility settings. More... | |
| void | setupDefaultMenu (MenuOptions optionsToProvide) |
| The user can add menu items from parent classes, but there are some menu items that are common between many types of plot windows. More... | |
Static Private Member Functions | |
| static bool | numericStringLessThan (QString left, QString right) |
Private Attributes | |
| QWidget * | m_parent |
| Parent widget. More... | |
| QwtPlotZoomer * | m_zoomer |
| Plot Zoomer. More... | |
| QwtPlotGrid * | m_grid |
| Plot grid lines. More... | |
| QCheckBox * | m_autoScaleCheckBox |
| Set Scale Dialog's checkbox for enabling automatic scaling on x & y. More... | |
| QCheckBox * | m_xLogCheckBox |
| Set Scale Dialog's checkbox for using logarithmic scale for the x axis. More... | |
| QCheckBox * | m_yLogCheckBox |
| Set Scale Dialog's checkbox for using logarithmic scale for the y axis. More... | |
| QLineEdit * | m_xMinEdit |
| Set Scale Dialog's edit for the min X-axis value. More... | |
| QLineEdit * | m_xMaxEdit |
| Set Scale Dialog's edit for the max X-axis value. More... | |
| QLineEdit * | m_yMinEdit |
| Set Scale Dialog's edit for the min Y-axis value. More... | |
| QLineEdit * | m_yMaxEdit |
| Set Scale Dialog's edit for the max Y-axis value. More... | |
| QLineEdit * | m_xAxisText |
| Set Labels Dialog's edit for the x-axis label. More... | |
| QLineEdit * | m_yAxisText |
| Set Labels Dialog's edit for the y-axis label. More... | |
| QLineEdit * | m_plotTitleText |
| Set Labels Dialog's edit for the plot title. More... | |
| QMenuBar * | m_menubar |
| Plot window's menu bar. More... | |
| QAction * | m_pasteAct |
| This is the paste action in the edit menu to paste a curve into the plot window. More... | |
| QPointer< QAction > | m_action |
| Plot window's action. More... | |
| QPointer< QAction > | m_showHideAllCurves |
| Hide all curves action. More... | |
| QPointer< QAction > | m_showHideAllMarkers |
| Hide all markers action. More... | |
| QPointer< QAction > | m_showHideGrid |
| Show plot grid lines action. More... | |
| PlotCurve::Units | m_xAxisUnits |
| The units of the data on the x-bottom axis. More... | |
| PlotCurve::Units | m_yAxisUnits |
| The units of the data on the y-left axis. More... | |
| bool | m_allowUserToAddCurves |
| Is the window showing the curve markers? More... | |
| bool | m_autoscaleAxes |
| True if we are autoscaling the x-bottom and y-left axes. More... | |
| QwtPlot * | m_plot |
| The plot in this window. More... | |
| QwtLegend * | m_legend |
| The legend inserted in this plot. More... | |
| bool | m_plotXLogScale |
| Tracks if the plot X axis is using a log (true) or linear (false) scale. More... | |
| bool | m_plotYLogScale |
| Tracks if the plot Y axis is using a log (true) or linear (false) scale. More... | |
| TableMainWindow * | m_tableWindow |
| Table window. More... | |
| QToolBar * | m_toolBar |
| Tool bar on the plot window. More... | |
| bool | m_scheduledFillTable |
2010-11-08 Eric Hyer - Added replot method
2011-03-18 Sharmila Prasad - Connect the viewport's close signal
2011-03-23 Sharmila Prasad - PlotWindow to be ontop even when it loses focus. This works for both histogram and plot tools.
2011-09-21 Steven Lambright - Removed the fixed size from the configure curve dialog. Fixes #203.
2012-07-03 Steven Lambright - Added labels for Meters/Kilometers units.
2013-02-21 Steven Lambright - Added methods requestFillTable(), scheduleFillTable() in order to increase performance. References #710.
2014-06-23 Ian Humphrey - Modified hard coded /usgs/cpkgs/ paths to relative pathnames. Fixes #2054.
2014-07-02 Ian Humphrey - Added method configurePlotCurves() to create a configure tool that allows user to select which curve to configure from a combo box. Added MenuOption ConfigurePlotMenuOption. Fixes #2089.
2014-07-24 Ian Humphrey - Modified plotCurves() and plotSpectrograms() methods to return a list of curves/spectrograms in the order they appear in the plot (instead of reversed). Used for refactoring. References #2089.
2016-09-14 Ian Humphrey - Modified printPlot() and save() - replaced deprecated static QPixmap::grabWidget with QWidget::grab. References #4304.
2017-05-19 Adam Paquette - Uncommented and modified code for a help menu in the plotting tools. Fixes #2126
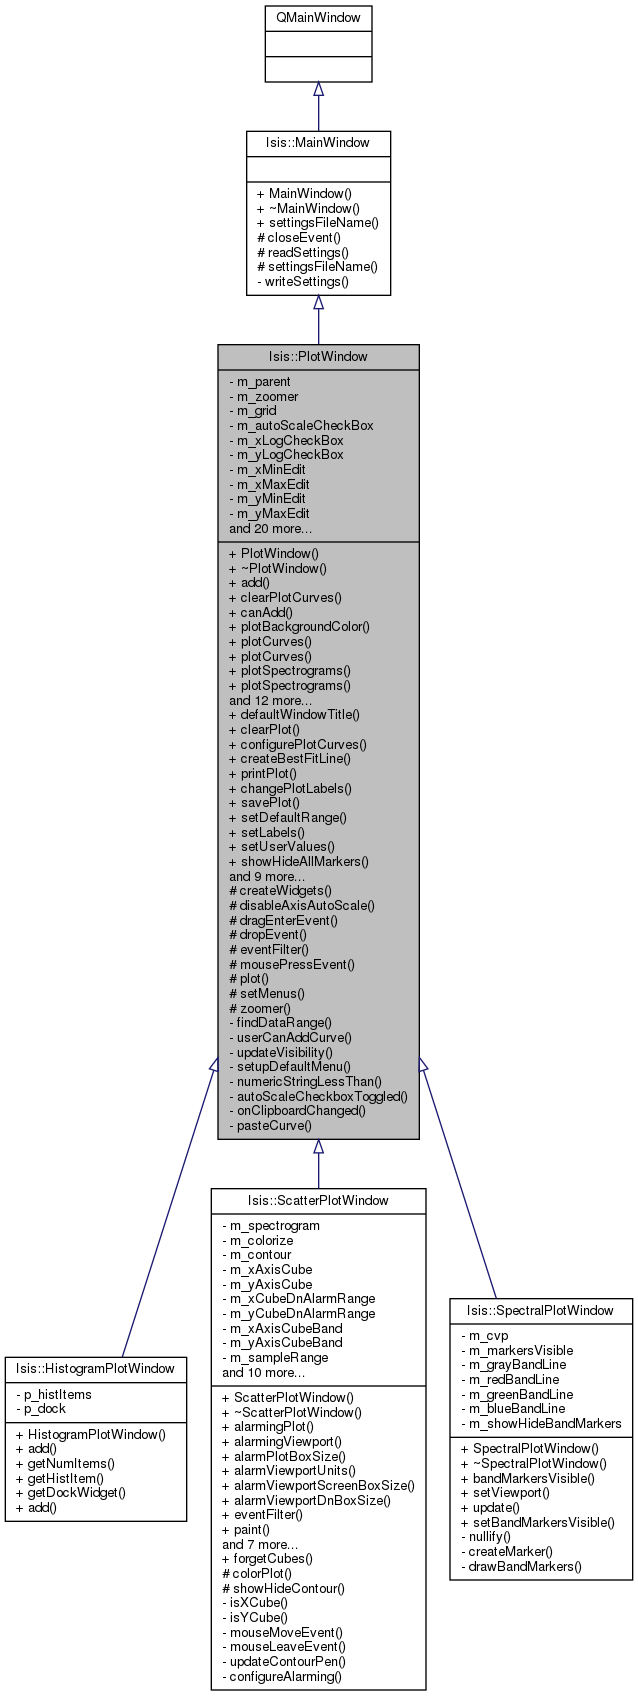
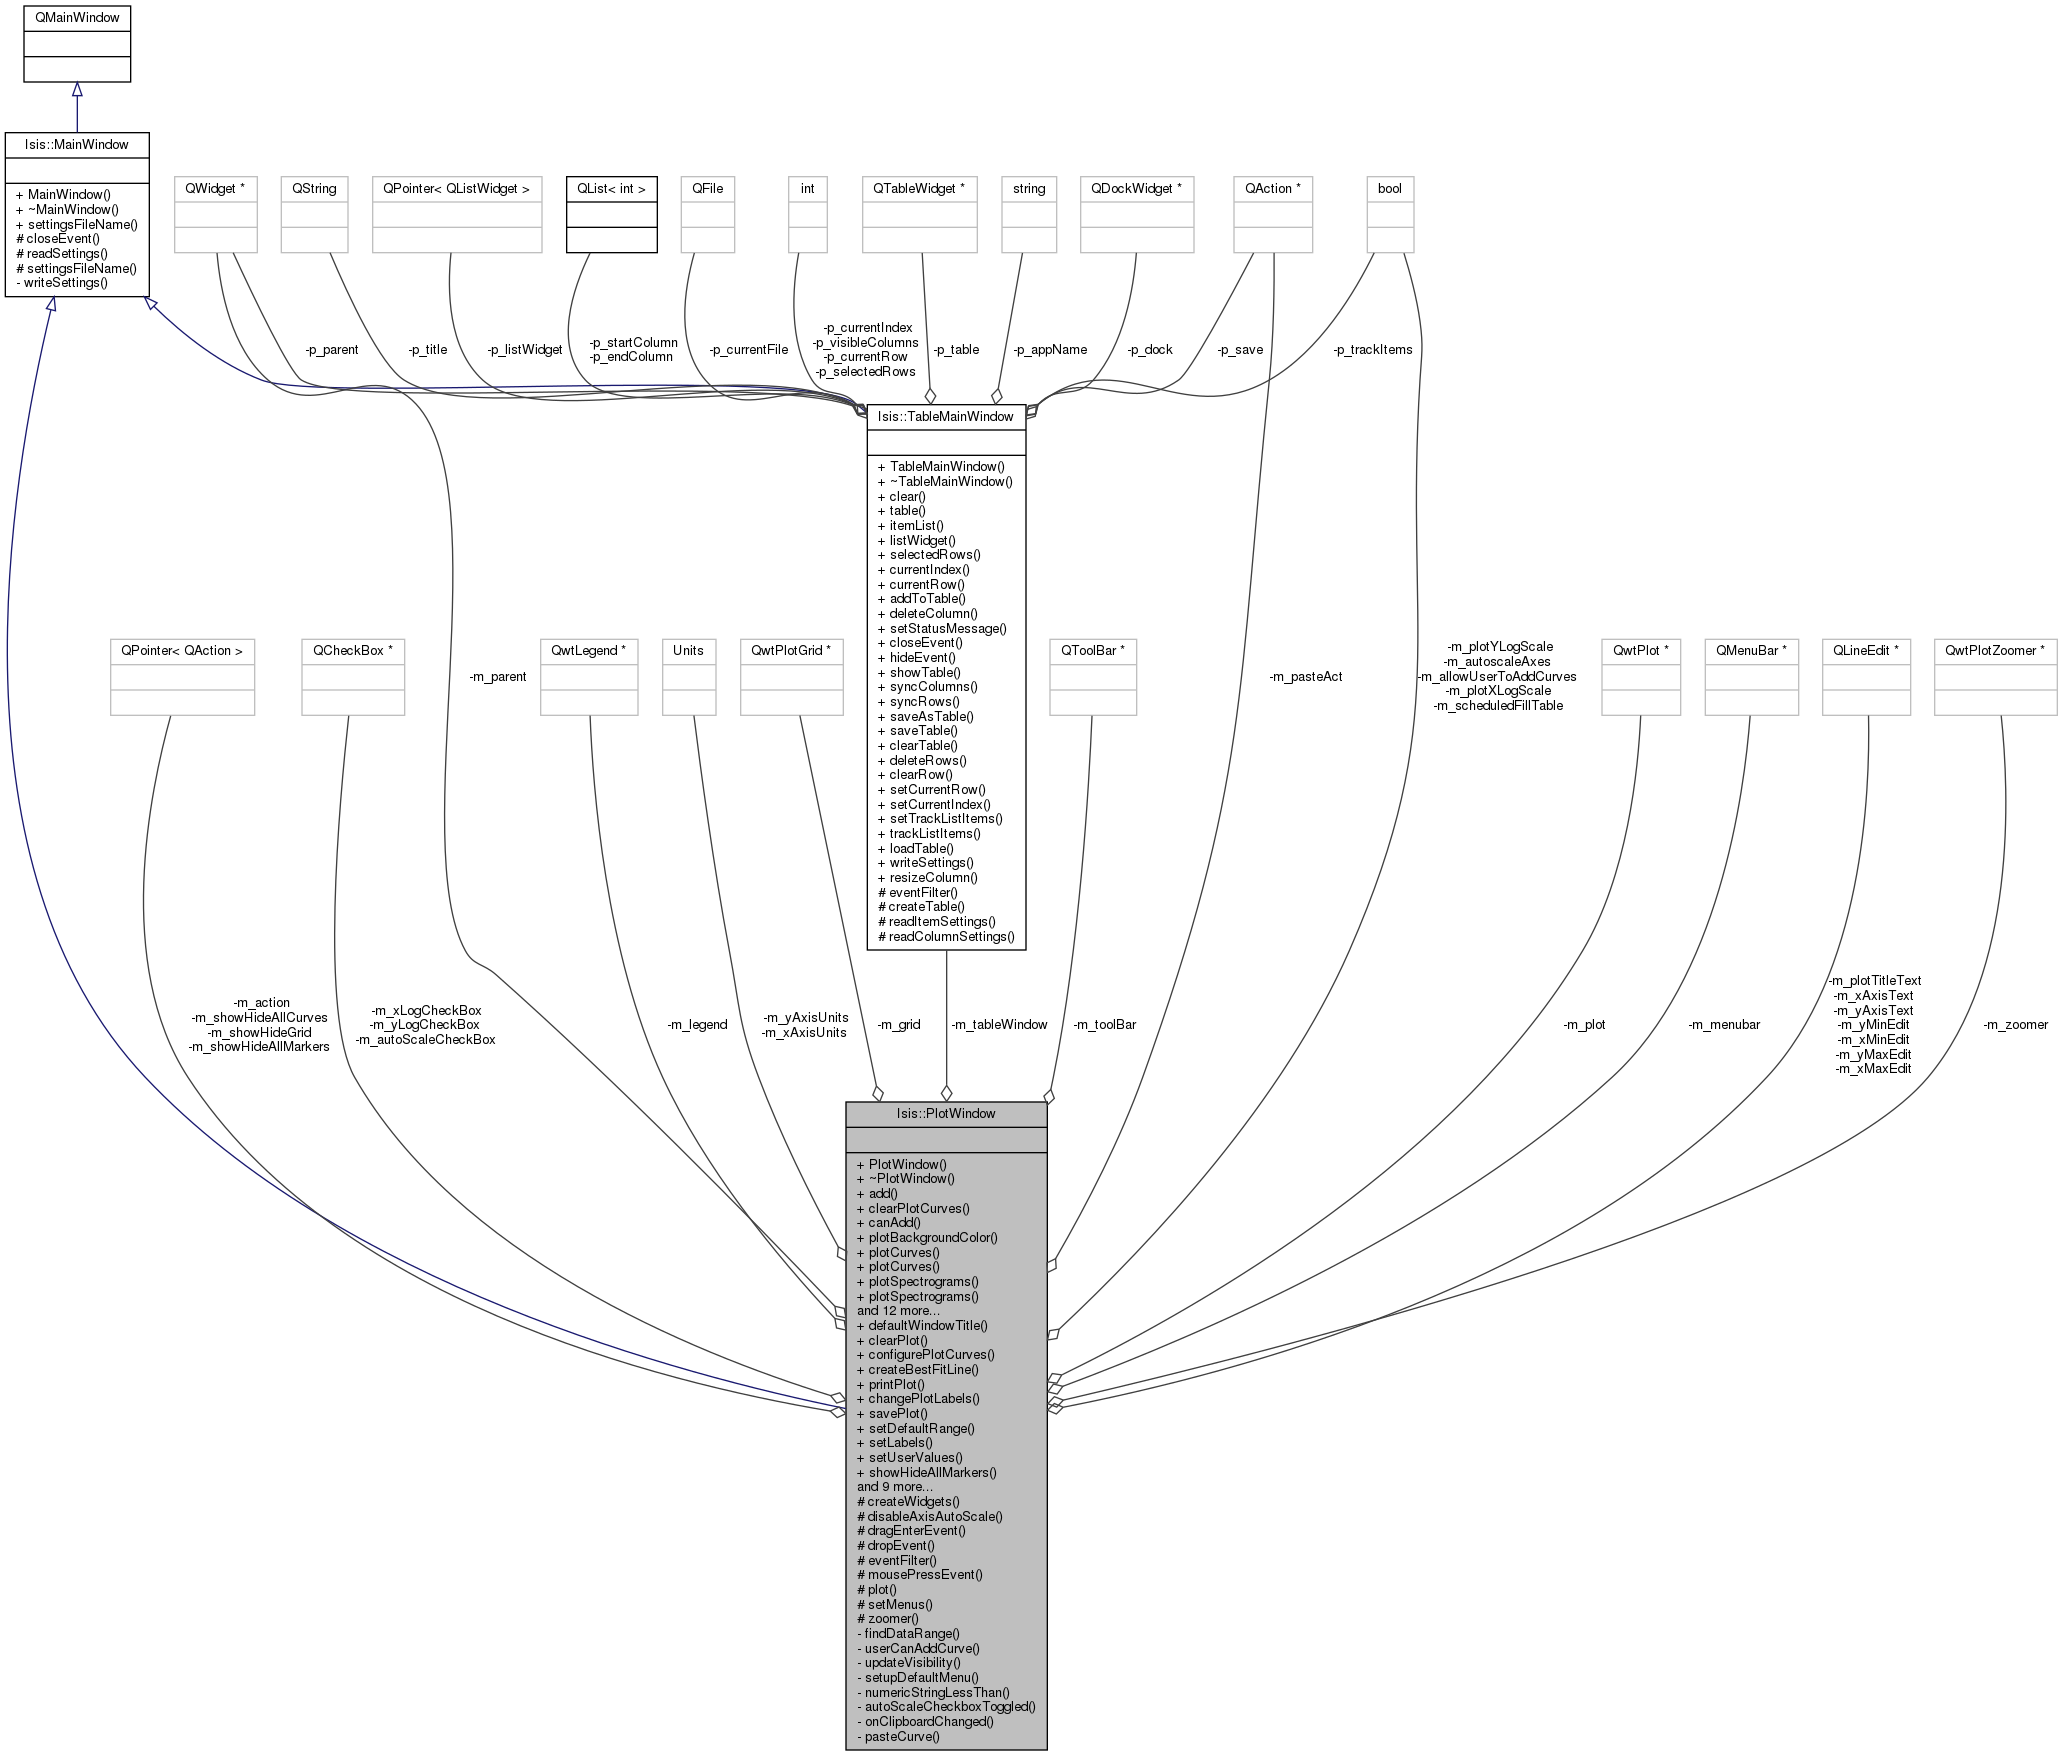
Definition at line 88 of file PlotWindow.h.
There is a menu option for everything in the plot window's menu.
This is provided so that you can enable/disable any given option.
Definition at line 96 of file PlotWindow.h.
| Isis::PlotWindow::PlotWindow | ( | QString | title, |
| PlotCurve::Units | xAxisUnits, | ||
| PlotCurve::Units | yAxisUnits, | ||
| QWidget * | parent, | ||
| MenuOptions | optionsToProvide = AllMenuOptions |
||
| ) |
This constructs a plot window.
The plot window graphs any curve sent to it via the addPlotCurve() method.
| title | The window title and default plot title |
| xAxisUnits | The x-bottom axis data's units, which must match any curves' units that are added to this window. |
| yAxisUnits | The y-left axis data's units, which must match any curves' units that are added to this window. |
| parent | The Qt parent widget |
| optionsToProvide | A bit-flag containing information on which options to provide to the users. |
Definition at line 66 of file PlotWindow.cpp.
References _FILEINFO_, Isis::PlotCurve::Band, createWidgets(), Isis::PlotCurve::CubeDN, Isis::PlotCurve::Elevation, fillTable(), Isis::PlotCurve::Kilometers, m_allowUserToAddCurves, m_autoscaleAxes, m_menubar, m_parent, m_pasteAct, m_tableWindow, m_toolBar, m_xAxisUnits, m_yAxisUnits, Isis::PlotCurve::Meters, onClipboardChanged(), Isis::PlotCurve::Percentage, Isis::PlotCurve::PixelNumber, plot(), plotChanged(), Isis::IException::Programmer, Isis::MainWindow::readSettings(), scheduleFillTable(), setPlotBackground(), setPlotTitle(), Isis::PlotCurve::Wavelength, xAxisUnits(), and yAxisUnits().
|
virtual |
This method adds the curves to the plot.
| pc |
Definition at line 436 of file PlotWindow.cpp.
References Isis::PlotCurve::attachMarkers(), canAdd(), fillTable(), m_legend, m_plot, plot(), plotChanged(), replot(), resetScale(), Isis::CubePlotCurve::updateLegendItemWidget(), and updateVisibility().
Referenced by dropEvent(), pasteCurve(), Isis::SpatialPlotTool::validatePlotCurves(), and Isis::SpectralPlotTool::validatePlotCurves().
|
privateslot |
This is a helper method for the set scale configuration dialog.
This enables or disables options inside of the dialog when a checkbox is clicked in the dialog. This does not change the state of the plot or plot zoomer.
Definition at line 1675 of file PlotWindow.cpp.
References m_autoScaleCheckBox, m_xMaxEdit, m_xMinEdit, m_yMaxEdit, and m_yMinEdit.
Referenced by setDefaultRange().
| bool Isis::PlotWindow::canAdd | ( | CubePlotCurve * | curveToTest | ) | const |
This method tests whethere or not a CubePlotCurve can be successfully added to this window.
Plot curves with mismatched X/Y data from the plot's x/y axis types can not be added to the window. This does not test whether or not a user is allowed to add the curve manually, just if the curve can be added programatically.
| curveToTest | The plot curve to test for compatibility with this window |
Definition at line 305 of file PlotWindow.cpp.
References m_xAxisUnits, m_yAxisUnits, Isis::PlotCurve::xUnits(), and Isis::PlotCurve::yUnits().
Referenced by add(), and userCanAddCurve().
|
slot |
This method creates the dialog box which allows the user to relabel the plot window.
Definition at line 854 of file PlotWindow.cpp.
References m_plot, m_plotTitleText, m_xAxisText, m_yAxisText, plot(), and setLabels().
Referenced by setupDefaultMenu().
|
slot |
This method completely clears the plot of all plot items.
i.e. curves and markers, which also deletes the legend also calls the necessary method to delete the table stuff
Definition at line 492 of file PlotWindow.cpp.
References clearPlotCurves(), m_tableWindow, and Isis::TableMainWindow::table().
Referenced by setupDefaultMenu().
|
virtual |
This method also clears the plot of all plot items, but does not call the table delete stuff This method is called from plotTool each time the changePlot() method is called.
Definition at line 540 of file PlotWindow.cpp.
References m_plot, and replot().
Referenced by clearPlot().
|
signal |
Emitted when there is a close event on this window that will be accepted.
Referenced by eventFilter().
|
protectedvirtualinherited |
This method is overridden so that we can be sure to write the current settings of the Main window.
| event |
Reimplemented in Isis::TableMainWindow, and Isis::ViewportMainWindow.
Definition at line 37 of file MainWindow.cpp.
References Isis::MainWindow::writeSettings().
Referenced by Isis::ViewportMainWindow::closeEvent(), and Isis::TableMainWindow::closeEvent().
|
slot |
This method creates a CubePlotCurveConfigureDialog object.
When there are no curves in this PlotWindow, the dialog will not be created.
Definition at line 508 of file PlotWindow.cpp.
References plotChanged(), and plotCurves().
Referenced by setupDefaultMenu().
|
slot |
This method prompts the user to select the best fit line criterea.
The PlotWindowBestFitDialog will create the best fit line automatically when the user asks for one, so we don't need to worry about doing any more than showing a dialog here.
Definition at line 529 of file PlotWindow.cpp.
References plot().
Referenced by setupDefaultMenu().
|
protected |
This method is called by the constructor to create the plot, legend.
zoomer, and main window.
| optionsToProvide | This is a bit-flag containing information on which menu options to give the user/put in the GUI. |
Definition at line 145 of file PlotWindow.cpp.
References m_grid, m_legend, m_plot, m_zoomer, and setupDefaultMenu().
Referenced by PlotWindow().
|
static |
This is the typical suffix for plot windows, it's here in case we want to update all plot windows to have a different ending than just 'Plot' on them (for example, 'Plot Window').
Definition at line 1810 of file PlotWindow.cpp.
Referenced by Isis::HistogramTool::createWindow(), Isis::SpectralPlotTool::createWindow(), and Isis::SpatialPlotTool::createWindow().
|
protected |
This turns off scaling the x/y axes automatically.
Use this if you have a very specific axis range you want to use, but keep in mind that users (potentially) have an option to re-enable axis auto scaling if they want to.
Definition at line 1664 of file PlotWindow.cpp.
References m_autoscaleAxes.
Referenced by Isis::ScatterPlotWindow::ScatterPlotWindow().
|
protectedvirtual |
When a user drags data into our plot window, we need to indicate whether or not this data is compatible with this window.
This checks userCanAddCurve() on the drag & drop data and allows or disallowed the event accordingly.
| event | The drag event to test |
Definition at line 1823 of file PlotWindow.cpp.
References m_legend, and userCanAddCurve().
|
protectedvirtual |
This is called when a user drops data into our window.
The dragEnterEvent() must have said that this curve is compatible with this window. This provides all of the available options to the user (if any) set by the creator of the drag & drop event (i.e. whether or not we can move or just copy). If there are options, we create a context menu - otherwise the default action is taken.
| event | The drop event containing the curve to put into the current window. |
Definition at line 1844 of file PlotWindow.cpp.
References add(), m_allowUserToAddCurves, and plotChanged().
|
protectedvirtual |
This method filters the events of the objects it is connected to.
In this case, the eventFilter has been installed on the m_plot and m_legend.
| o | |
| e |
Reimplemented in Isis::ScatterPlotWindow.
Definition at line 1590 of file PlotWindow.cpp.
References closed(), mousePressEvent(), and plot().
Referenced by Isis::ScatterPlotWindow::eventFilter().
|
slot |
Fills in the table with the data from the current curves in the plotWindow immediately.
Definition at line 1411 of file PlotWindow.cpp.
References Isis::TableMainWindow::addToTable(), Isis::IsSpecial(), Isis::TableMainWindow::listWidget(), m_plot, m_tableWindow, Isis::Null, plotCurves(), Isis::TableMainWindow::table(), Isis::toDouble(), and Isis::toString().
Referenced by add(), PlotWindow(), and showTable().
|
private |
This calculates the data range of the specified axis (works with xBottom and yLeft only).
This is used to provide unit context (band #'s shouldn't ever pad) and to fix the lack of an axis when only one value exists (if there is only one x-value, this will always pad with +/- 0.5).
| axisId | This must be yLeft or xBottom |
Definition at line 1722 of file PlotWindow.cpp.
References plotCurves().
Referenced by resetScale().
|
protected |
This is a helper method for the eventFilter() method.
When a mouse press event is seen, this handles it. For example, if the user right clicks and the clipboard contains compatible data then this will give a paste option.
| object | The object which was pressed |
| event | The mouse event which contains button information |
Definition at line 1628 of file PlotWindow.cpp.
References pasteCurve(), and userCanAddCurve().
Referenced by eventFilter().
|
privateslot |
This slot will be called when the system clipboard is changed.
Definition at line 1686 of file PlotWindow.cpp.
References m_pasteAct, and userCanAddCurve().
Referenced by PlotWindow().
|
virtual |
Paint plot curve information onto the viewport.
| vp | The cube viewport to paint onto |
| painter | The painter to use for painting |
Reimplemented in Isis::ScatterPlotWindow.
Definition at line 1787 of file PlotWindow.cpp.
References Isis::CubePlotCurve::paint(), and plotCurves().
Referenced by Isis::ScatterPlotWindow::paint(), and Isis::AbstractPlotTool::paintViewport().
|
privateslot |
When the user pastes a curve try to put it into this plot window.
This shouldn't be called when the curve on the system clipboard isn't compatible.
Definition at line 1697 of file PlotWindow.cpp.
References add(), m_allowUserToAddCurves, and plotChanged().
Referenced by mousePressEvent(), and setupDefaultMenu().
|
protected |
Get the plot encapsulated by this PlotWindow.
Definition at line 1653 of file PlotWindow.cpp.
References m_plot.
Referenced by Isis::HistogramPlotWindow::add(), add(), changePlotLabels(), Isis::ScatterPlotWindow::colorPlot(), createBestFitLine(), Isis::SpectralPlotWindow::createMarker(), Isis::SpectralPlotWindow::drawBandMarkers(), Isis::ScatterPlotWindow::eventFilter(), eventFilter(), Isis::HistogramPlotWindow::HistogramPlotWindow(), Isis::ScatterPlotWindow::mouseMoveEvent(), PlotWindow(), Isis::ScatterPlotWindow::ScatterPlotWindow(), setDefaultRange(), and Isis::ScatterPlotWindow::setMousePosition().
| QColor Isis::PlotWindow::plotBackgroundColor | ( | ) | const |
Returns the plot's background color.
Definition at line 317 of file PlotWindow.cpp.
References m_plot.
|
signal |
Emitted every time there is a change to the plot window.
Referenced by add(), configurePlotCurves(), dropEvent(), Isis::ScatterPlotWindow::mouseLeaveEvent(), Isis::ScatterPlotWindow::mouseMoveEvent(), pasteCurve(), PlotWindow(), replot(), and updateVisibility().
| QList< CubePlotCurve * > Isis::PlotWindow::plotCurves | ( | ) |
Get a comprehensive list of the plot curves inside of this plot window, excluding plot curves that are in the process of being removed.
Definition at line 328 of file PlotWindow.cpp.
References Isis::PlotCurve::color(), and m_plot.
Referenced by configurePlotCurves(), fillTable(), findDataRange(), paint(), and showTable().
| QList< const CubePlotCurve * > Isis::PlotWindow::plotCurves | ( | ) | const |
Get a comprehensive const list of the plot curves inside of this plot window, excluding plot curves that are in the process of being removed.
Definition at line 354 of file PlotWindow.cpp.
References m_plot.
| QList< QwtPlotSpectrogram * > Isis::PlotWindow::plotSpectrograms | ( | ) |
Get a comprehensive list of the scatter plots (spectrograms) inside of this plot window.
Definition at line 381 of file PlotWindow.cpp.
References m_plot.
| QList< const QwtPlotSpectrogram * > Isis::PlotWindow::plotSpectrograms | ( | ) | const |
Get a comprehensive const list of the scatter plots (spectrograms) inside of this plot window.
Definition at line 409 of file PlotWindow.cpp.
References m_plot.
| QString Isis::PlotWindow::plotTitle | ( | ) | const |
Returns the plot title.
Definition at line 241 of file PlotWindow.cpp.
References m_plot.
|
slot |
Provides printing support of the plot image.
Definition at line 573 of file PlotWindow.cpp.
References m_plot.
Referenced by setupDefaultMenu().
|
protectedvirtualinherited |
This method ensure that the settings get written even if the Main window was only hidden, not closed.
| event | This method is called from the constructor so that when the Main window is created, it know's it's size and location. |
Reimplemented in Isis::MosaicMainWindow.
Definition at line 80 of file MainWindow.cpp.
Referenced by PlotWindow(), Isis::MosaicMainWindow::readSettings(), Isis::TableMainWindow::TableMainWindow(), and Isis::ViewportMainWindow::ViewportMainWindow().
| void Isis::PlotWindow::replot | ( | ) |
Reset the scale of the plot, replot it and emit plot changed.
Definition at line 1797 of file PlotWindow.cpp.
References plotChanged(), and resetScale().
Referenced by add(), clearPlotCurves(), Isis::ScatterPlotWindow::colorPlot(), Isis::HistogramTool::refreshPlot(), Isis::SpatialPlotTool::refreshPlot(), Isis::SpectralPlotTool::refreshPlot(), Isis::ScatterPlotWindow::ScatterPlotWindow(), Isis::SpectralPlotWindow::setBandMarkersVisible(), setUserValues(), and Isis::ScatterPlotWindow::showHideContour().
|
slot |
Sets plot scale back to the defaults.
Definition at line 660 of file PlotWindow.cpp.
References Isis::PlotCurve::Band, findDataRange(), m_autoscaleAxes, m_plot, m_xAxisUnits, m_yAxisUnits, and m_zoomer.
Referenced by add(), replot(), and setupDefaultMenu().
|
slot |
This method allows the user to save the plot as a png, jpg, or tif image file.
Definition at line 605 of file PlotWindow.cpp.
References m_plot.
Referenced by setupDefaultMenu().
|
slot |
Fills in the table with the data from the current curves in the plotWindow once all current actions/activations are done.
This is provided for performance reasons - re-plotting 4 curves only requires one fillTable at the end, instead of after each curve change.
Definition at line 1399 of file PlotWindow.cpp.
Referenced by PlotWindow().
| void Isis::PlotWindow::setAxisLabel | ( | int | axisId, |
| QString | title | ||
| ) |
Sets the plots given axis title to the given string.
| axisId | |
| title |
Definition at line 208 of file PlotWindow.cpp.
References m_plot.
|
slot |
Resets the x/y min/max to the defaults.
Definition at line 743 of file PlotWindow.cpp.
References autoScaleCheckboxToggled(), m_autoscaleAxes, m_autoScaleCheckBox, m_plotXLogScale, m_plotYLogScale, m_xLogCheckBox, m_xMaxEdit, m_xMinEdit, m_yLogCheckBox, m_yMaxEdit, m_yMinEdit, plot(), and setUserValues().
Referenced by setupDefaultMenu().
|
slot |
Makes the user specified changes to the plot labels.
Definition at line 910 of file PlotWindow.cpp.
References m_plot, m_plotTitleText, m_xAxisText, and m_yAxisText.
Referenced by changePlotLabels().
Sets up the menus added from a parent object.
| menu | |
| actions |
Definition at line 1358 of file PlotWindow.cpp.
References m_menubar, and m_toolBar.
Referenced by setupDefaultMenu().
| void Isis::PlotWindow::setPlotBackground | ( | QColor | c | ) |
Sets the plot background color to the given color.
| c |
Definition at line 289 of file PlotWindow.cpp.
References m_plot.
Referenced by Isis::HistogramPlotWindow::HistogramPlotWindow(), and PlotWindow().
| void Isis::PlotWindow::setPlotTitle | ( | QString | pt | ) |
Sets the plot title to the given string.
This does not update the window title.
| pt | The plot title to use |
Definition at line 219 of file PlotWindow.cpp.
References m_plot.
Referenced by PlotWindow().
|
private |
The user can add menu items from parent classes, but there are some menu items that are common between many types of plot windows.
| optionsToProvide | A bit-flag containing information on which options to provide to the users. |
Definition at line 1048 of file PlotWindow.cpp.
References BackgroundSwitchMenuOption, changePlotLabels(), clearPlot(), ClearPlotMenuOption, configurePlotCurves(), ConfigurePlotMenuOption, createBestFitLine(), LineFitMenuOption, m_pasteAct, m_plot, m_showHideAllCurves, m_showHideAllMarkers, m_showHideGrid, pasteCurve(), PrintMenuOption, printPlot(), RenameLabelsMenuOption, resetScale(), ResetScaleMenuOption, SaveMenuOption, savePlot(), setDefaultRange(), SetDisplayRangeMenuOption, setMenus(), showHelp(), showHideAllCurves(), showHideAllMarkers(), ShowHideCurvesMenuOption, showHideGrid(), ShowHideGridMenuOption, ShowHideMarkersMenuOption, showTable(), ShowTableMenuOption, switchBackground(), trackerEnabled(), and TrackMenuOption.
Referenced by createWidgets().
| void Isis::PlotWindow::setUserCanAddCurves | ( | bool | userHasControl | ) |
Allow or disallow users from manually putting curves into this plot window through either copy-and-paste or drag-and-drop.
| userHasControl | True if users can add curves manually, false otherwise |
Definition at line 231 of file PlotWindow.cpp.
References m_allowUserToAddCurves.
|
slot |
This method sets the scale for the axis according to the user specified numbers.
Definition at line 694 of file PlotWindow.cpp.
References m_autoscaleAxes, m_autoScaleCheckBox, m_plot, m_plotXLogScale, m_plotYLogScale, m_xLogCheckBox, m_xMaxEdit, m_xMinEdit, m_yLogCheckBox, m_yMaxEdit, m_yMinEdit, m_zoomer, and replot().
Referenced by setDefaultRange().
|
slot |
This method creates and shows the help dialog box for the plot window.
this is called from the Help–>Basic Help menu.
Definition at line 999 of file PlotWindow.cpp.
References m_plot.
Referenced by setupDefaultMenu().
|
slot |
This method shows or hides all of the curves in the plotWindow.
Definition at line 967 of file PlotWindow.cpp.
References m_plot, and m_showHideAllCurves.
Referenced by setupDefaultMenu().
|
slot |
Shows/Hides all the markers(symbols)
Definition at line 939 of file PlotWindow.cpp.
References m_plot, and m_showHideAllMarkers.
Referenced by setupDefaultMenu().
|
slot |
This method hides/shows the grid on the plotWindow and changes the text for the action.
Definition at line 923 of file PlotWindow.cpp.
References m_grid, m_plot, and m_showHideGrid.
Referenced by setupDefaultMenu().
|
slot |
This method is called from the showTable action on the tool bar There are some checks done to make sure there are data to fill the table.
Definition at line 1566 of file PlotWindow.cpp.
References fillTable(), m_parent, m_tableWindow, plotCurves(), Isis::TableMainWindow::setTrackListItems(), and Isis::TableMainWindow::syncColumns().
Referenced by setupDefaultMenu().
| void Isis::PlotWindow::showWindow | ( | ) |
Shows the plot window, and raises it to the front of any overlapping sibling widgets.
Definition at line 185 of file PlotWindow.cpp.
Referenced by Isis::AbstractPlotTool::selectedWindowChanged(), and Isis::AbstractPlotTool::showPlotWindow().
|
slot |
This method toggles the plot background color between black and white.
Definition at line 635 of file PlotWindow.cpp.
References m_grid, m_plot, and m_zoomer.
Referenced by setupDefaultMenu().
|
slot |
Enables the plot mouse tracker.
Definition at line 560 of file PlotWindow.cpp.
References m_zoomer.
Referenced by setupDefaultMenu().
|
virtual |
This is provided to allow children to react to tool updates.
This is useful for example for band markers in the spectral plots.
| activeViewport | The currently selected viewport |
Reimplemented in Isis::SpectralPlotWindow.
Definition at line 197 of file PlotWindow.cpp.
Referenced by Isis::AbstractPlotTool::updateTool().
|
private |
This method sets the visibility states in the curve (and it's symbols) to match with this window's current visibility settings.
Every means of adding a curve to the window needs to call this with the curve that is being added, otherwise visibility states will not be consistent.
| curve | Curve (with symbols) to set the visibility states on |
Definition at line 1330 of file PlotWindow.cpp.
References m_showHideAllCurves, m_showHideAllMarkers, plotChanged(), and Isis::PlotCurve::setMarkerVisible().
Referenced by add().
|
private |
Ask if a user action can add this curve to this window.
This verifies that the user is allowed to add curves to this window and that programmatically the curve can be added (i.e. things such as the X/Y data units match).
| curve | Mime-data containing a plot curve to be added |
Definition at line 1306 of file PlotWindow.cpp.
References canAdd(), and m_allowUserToAddCurves.
Referenced by dragEnterEvent(), mousePressEvent(), and onClipboardChanged().
| bool Isis::PlotWindow::userCanAddCurves | ( | ) | const |
Ask if a user action can add this curve to this window in general.
This verifies that the user is allowed to add curves to this window but not that a particular curve is compatible with this window.
Definition at line 254 of file PlotWindow.cpp.
References m_allowUserToAddCurves.
| PlotCurve::Units Isis::PlotWindow::xAxisUnits | ( | ) | const |
This is the data-type of the curves' x data in this plot window.
All of the cube plot curves must have the same units for x axis data or the display will not make sense.
Definition at line 266 of file PlotWindow.cpp.
References m_xAxisUnits.
Referenced by Isis::SpectralPlotWindow::drawBandMarkers(), PlotWindow(), Isis::SpatialPlotTool::refreshPlot(), and Isis::SpectralPlotTool::refreshPlot().
| PlotCurve::Units Isis::PlotWindow::yAxisUnits | ( | ) | const |
This is the data-type of the curves' y data in this plot window.
All of the cube plot curves must have the same units for y-left axis data (y-right sometimes has different units) or the display will not make sense.
Definition at line 278 of file PlotWindow.cpp.
References m_yAxisUnits.
Referenced by PlotWindow().
|
protected |
Get this window's plot's zoomer.
Definition at line 1388 of file PlotWindow.cpp.
References m_zoomer.
Referenced by Isis::ScatterPlotWindow::ScatterPlotWindow().
|
private |
Plot window's action.
Definition at line 312 of file PlotWindow.h.
|
private |
Is the window showing the curve markers?
Definition at line 326 of file PlotWindow.h.
Referenced by dropEvent(), pasteCurve(), PlotWindow(), setUserCanAddCurves(), userCanAddCurve(), and userCanAddCurves().
|
private |
True if we are autoscaling the x-bottom and y-left axes.
Definition at line 328 of file PlotWindow.h.
Referenced by disableAxisAutoScale(), PlotWindow(), resetScale(), setDefaultRange(), and setUserValues().
|
private |
Set Scale Dialog's checkbox for enabling automatic scaling on x & y.
Definition at line 281 of file PlotWindow.h.
Referenced by autoScaleCheckboxToggled(), setDefaultRange(), and setUserValues().
|
private |
Plot grid lines.
Definition at line 279 of file PlotWindow.h.
Referenced by createWidgets(), showHideGrid(), and switchBackground().
|
private |
The legend inserted in this plot.
Definition at line 331 of file PlotWindow.h.
Referenced by add(), createWidgets(), and dragEnterEvent().
|
private |
Plot window's menu bar.
Definition at line 302 of file PlotWindow.h.
Referenced by PlotWindow(), and setMenus().
|
private |
Parent widget.
Definition at line 275 of file PlotWindow.h.
Referenced by PlotWindow(), and showTable().
|
private |
This is the paste action in the edit menu to paste a curve into the plot window.
This is enabled or disabled based on what is in the clipboard.
Definition at line 309 of file PlotWindow.h.
Referenced by onClipboardChanged(), PlotWindow(), and setupDefaultMenu().
|
private |
The plot in this window.
Definition at line 330 of file PlotWindow.h.
Referenced by add(), changePlotLabels(), clearPlotCurves(), createWidgets(), fillTable(), plot(), plotBackgroundColor(), plotCurves(), plotSpectrograms(), plotTitle(), printPlot(), resetScale(), savePlot(), setAxisLabel(), setLabels(), setPlotBackground(), setPlotTitle(), setupDefaultMenu(), setUserValues(), showHelp(), showHideAllCurves(), showHideAllMarkers(), showHideGrid(), and switchBackground().
|
private |
Set Labels Dialog's edit for the plot title.
Definition at line 299 of file PlotWindow.h.
Referenced by changePlotLabels(), and setLabels().
|
private |
Tracks if the plot X axis is using a log (true) or linear (false) scale.
Definition at line 332 of file PlotWindow.h.
Referenced by setDefaultRange(), and setUserValues().
|
private |
Tracks if the plot Y axis is using a log (true) or linear (false) scale.
Definition at line 333 of file PlotWindow.h.
Referenced by setDefaultRange(), and setUserValues().
|
private |
Hide all curves action.
Definition at line 314 of file PlotWindow.h.
Referenced by setupDefaultMenu(), showHideAllCurves(), and updateVisibility().
|
private |
Hide all markers action.
Definition at line 316 of file PlotWindow.h.
Referenced by setupDefaultMenu(), showHideAllMarkers(), and updateVisibility().
|
private |
Show plot grid lines action.
Definition at line 318 of file PlotWindow.h.
Referenced by setupDefaultMenu(), and showHideGrid().
|
private |
Table window.
Definition at line 334 of file PlotWindow.h.
Referenced by clearPlot(), fillTable(), PlotWindow(), and showTable().
|
private |
Tool bar on the plot window.
Definition at line 335 of file PlotWindow.h.
Referenced by PlotWindow(), and setMenus().
|
private |
Set Labels Dialog's edit for the x-axis label.
Definition at line 295 of file PlotWindow.h.
Referenced by changePlotLabels(), and setLabels().
|
private |
The units of the data on the x-bottom axis.
Definition at line 321 of file PlotWindow.h.
Referenced by canAdd(), PlotWindow(), resetScale(), and xAxisUnits().
|
private |
Set Scale Dialog's checkbox for using logarithmic scale for the x axis.
Definition at line 283 of file PlotWindow.h.
Referenced by setDefaultRange(), and setUserValues().
|
private |
Set Scale Dialog's edit for the max X-axis value.
Definition at line 289 of file PlotWindow.h.
Referenced by autoScaleCheckboxToggled(), setDefaultRange(), and setUserValues().
|
private |
Set Scale Dialog's edit for the min X-axis value.
Definition at line 287 of file PlotWindow.h.
Referenced by autoScaleCheckboxToggled(), setDefaultRange(), and setUserValues().
|
private |
Set Labels Dialog's edit for the y-axis label.
Definition at line 297 of file PlotWindow.h.
Referenced by changePlotLabels(), and setLabels().
|
private |
The units of the data on the y-left axis.
Definition at line 323 of file PlotWindow.h.
Referenced by canAdd(), PlotWindow(), resetScale(), and yAxisUnits().
|
private |
Set Scale Dialog's checkbox for using logarithmic scale for the y axis.
Definition at line 285 of file PlotWindow.h.
Referenced by setDefaultRange(), and setUserValues().
|
private |
Set Scale Dialog's edit for the max Y-axis value.
Definition at line 293 of file PlotWindow.h.
Referenced by autoScaleCheckboxToggled(), setDefaultRange(), and setUserValues().
|
private |
Set Scale Dialog's edit for the min Y-axis value.
Definition at line 291 of file PlotWindow.h.
Referenced by autoScaleCheckboxToggled(), setDefaultRange(), and setUserValues().
|
private |
Plot Zoomer.
Definition at line 277 of file PlotWindow.h.
Referenced by createWidgets(), resetScale(), setUserValues(), switchBackground(), trackerEnabled(), and zoomer().