 |
Isis 3 Programmer Reference
|
|
Isis 3 Programmer Reference
|
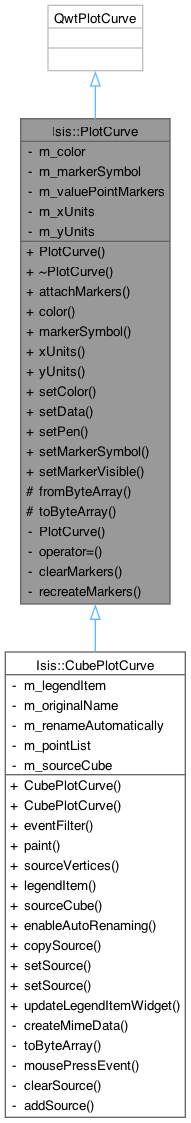
#include <PlotCurve.h>
Public Types | |
| enum | Units { Unknown , Band , CubeDN , Elevation , Percentage , PixelNumber , Meters , Kilometers , Wavelength } |
| These are all the possible units for the x or y data in a plot curve. More... | |
Public Member Functions | |
| PlotCurve (Units xUnits, Units yUnits) | |
| Constructs and instance of a PlotCurve with some default properties. | |
| void | attachMarkers () |
| After attaching this curve to a plot, due to an inheritance/implementation complication with qwt the markers will remain detached until they are recreated. | |
| QColor | color () const |
| This method returns the color of the curve. | |
| QwtSymbol * | markerSymbol () const |
| This method returns the shape of the markers. | |
| Units | xUnits () const |
| Get the units of the x-axis double data. | |
| Units | yUnits () const |
| Get the units of the y-axis double data. | |
| void | setColor (const QColor &color) |
| Set the color of this curve and it's markers. | |
| void | setData (QwtSeriesData< QPointF > *data) |
| This method sets the data for the curve, then sets the value for the markers associated with the curve. | |
| void | setPen (const QPen &pen) |
| Sets the plot pen to the passed-in pen. | |
| void | setMarkerSymbol (QwtSymbol::Style style) |
| This method sets the shape of the markers. | |
| void | setMarkerVisible (bool visible) |
| This method sets the visibility states of the markers at each value point. | |
Protected Member Functions | |
| QByteArray | fromByteArray (const QByteArray &classData) |
| Construct the plot curve given the past results of toByteArray(...). | |
| QByteArray | toByteArray () const |
Private Member Functions | |
| PlotCurve (const PlotCurve &other) | |
| PlotCurve & | operator= (const PlotCurve &other) |
| void | clearMarkers () |
| void | recreateMarkers () |
Private Attributes | |
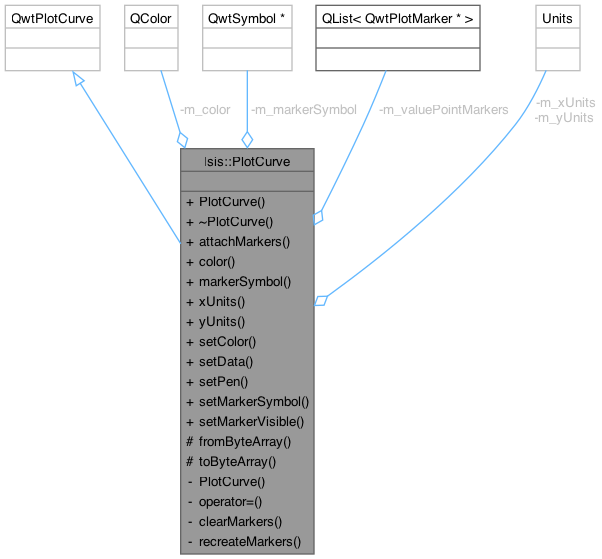
| QColor | m_color |
| QwtSymbol * | m_markerSymbol |
| Marker's styles. | |
| QList< QwtPlotMarker * > | m_valuePointMarkers |
| Units | m_xUnits |
| Units | m_yUnits |
2012-01-20 Steven Lambright - Completed documentation.
2012-07-03 Steven Lambright - Added Meters, Kilometers to the Units enum. References #853.
2014-04-15 Tracie Sucharski - Reset defaults for plots to the following: SolidLine, Width=1, NoSymbols. This is a temporary fix until the defaults can be saved on a user basis. Fixes #2062.
Definition at line 44 of file PlotCurve.h.
These are all the possible units for the x or y data in a plot curve.
We want these in order to have type checking when moving curves around - it's theoretically possible to even utilize the right y axis automatically when you put mismatched plot curve y data into the same plot. All of this and more requires knowing your data's units.
| Enumerator | |
|---|---|
| Unknown | The data units are not yet known. Please avoid using this if at all possible. |
| Band | The data is a band number. |
| CubeDN | The data is a Cube DN value. |
| Elevation | The data is an elevation (in meters). |
| Percentage | The data is a percentage (0-100). |
| PixelNumber | The data is a pixel #. For example, it's the nth pixel along a line. |
| Meters | The data is in meters. For example, it's the nth meter along a line. |
| Kilometers | The data is in kilometers. For example, it's the nth kilometer along a line. |
| Wavelength | The data is a wavelength. This is usually associated with a band and comes from the band bin group. |
Definition at line 54 of file PlotCurve.h.
Constructs and instance of a PlotCurve with some default properties.
Definition at line 21 of file PlotCurve.cpp.
References m_markerSymbol, xUnits(), and yUnits().
| Isis::PlotCurve::~PlotCurve | ( | ) |
Definition at line 31 of file PlotCurve.cpp.
| void Isis::PlotCurve::attachMarkers | ( | ) |
After attaching this curve to a plot, due to an inheritance/implementation complication with qwt the markers will remain detached until they are recreated.
This forces the markers to be updated immediately.
Please always call this method after attaching this curve to a plot.
Definition at line 45 of file PlotCurve.cpp.
|
private |
Definition at line 348 of file PlotCurve.cpp.
| QColor Isis::PlotCurve::color | ( | ) | const |
This method returns the color of the curve.
Definition at line 55 of file PlotCurve.cpp.
Referenced by Isis::PlotWindowBestFitDialog::createBestFitLine(), Isis::CubePlotCurve::paint(), and setColor().
|
protected |
Construct the plot curve given the past results of toByteArray(...).
This is used for copy/paste and drag/drop.
Definition at line 144 of file PlotCurve.cpp.
References m_markerSymbol, Isis::IException::Programmer, setColor(), setData(), and setPen().
Referenced by Isis::CubePlotCurve::CubePlotCurve().
| QwtSymbol * Isis::PlotCurve::markerSymbol | ( | ) | const |
This method returns the shape of the markers.
Definition at line 65 of file PlotCurve.cpp.
References m_markerSymbol.
|
private |
Definition at line 358 of file PlotCurve.cpp.
| void Isis::PlotCurve::setColor | ( | const QColor & | color | ) |
Set the color of this curve and it's markers.
This color will override the pen's color always.
| color | The color of this curve. |
Definition at line 96 of file PlotCurve.cpp.
References color(), and setPen().
Referenced by fromByteArray(), and Isis::CubePlotCurve::mousePressEvent().
| void Isis::PlotCurve::setData | ( | QwtSeriesData< QPointF > * | data | ) |
This method sets the data for the curve, then sets the value for the markers associated with the curve.
| data |
Definition at line 108 of file PlotCurve.cpp.
Referenced by fromByteArray().
| void Isis::PlotCurve::setMarkerSymbol | ( | QwtSymbol::Style | style | ) |
This method sets the shape of the markers.
| style |
Definition at line 119 of file PlotCurve.cpp.
References m_markerSymbol.
| void Isis::PlotCurve::setMarkerVisible | ( | bool | visible | ) |
This method sets the visibility states of the markers at each value point.
| visible | True to show markers, false to hide |
Definition at line 130 of file PlotCurve.cpp.
| void Isis::PlotCurve::setPen | ( | const QPen & | pen | ) |
Sets the plot pen to the passed-in pen.
| pen |
Definition at line 338 of file PlotCurve.cpp.
Referenced by fromByteArray(), and setColor().
|
protected |
Definition at line 260 of file PlotCurve.cpp.
| PlotCurve::Units Isis::PlotCurve::xUnits | ( | ) | const |
Get the units of the x-axis double data.
Definition at line 75 of file PlotCurve.cpp.
Referenced by Isis::PlotWindowBestFitDialog::createBestFitLine(), and PlotCurve().
| PlotCurve::Units Isis::PlotCurve::yUnits | ( | ) | const |
Get the units of the y-axis double data.
Definition at line 85 of file PlotCurve.cpp.
Referenced by Isis::PlotWindowBestFitDialog::createBestFitLine(), and PlotCurve().
|
private |
Definition at line 123 of file PlotCurve.h.
|
private |
Marker's styles.
Definition at line 124 of file PlotCurve.h.
Referenced by fromByteArray(), markerSymbol(), PlotCurve(), and setMarkerSymbol().
|
private |
Definition at line 125 of file PlotCurve.h.
|
private |
Definition at line 126 of file PlotCurve.h.
|
private |
Definition at line 127 of file PlotCurve.h.