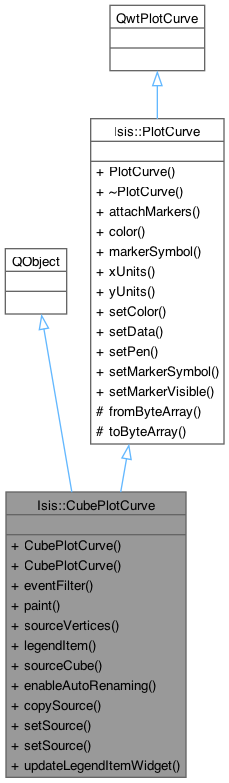
This is a plot curve with information relating it to a particular cube or region of a cube.
More...
|
| | CubePlotCurve (Units xUnits, Units yUnits) |
| | This constructs a CubePlotCurve... a subclass of PlotCurve.
|
| |
| | CubePlotCurve (const QByteArray &parentAndChildData) |
| | Construct the plot tool curve given the past results of toByteArray(...).
|
| |
| bool | eventFilter (QObject *o, QEvent *e) |
| | This will start the drag & drop operation for these curves.
|
| |
| void | paint (CubeViewport *vp, QPainter *painter) |
| | Use information inside of the plot curve to paint onto a cube viewport.
|
| |
| QList< QList< QPointF > > | sourceVertices () const |
| | This method returns a list of points which are the vertices of the selected area (by the rubberband) on the cvp.
|
| |
| virtual QWidget * | legendItem () const |
| | This method is necessary for getting the correct (event filter altered) legend item.
|
| |
| QStringList | sourceCube () const |
| | This method returns the cube view port associated with the curve.
|
| |
| void | enableAutoRenaming (bool) |
| | This enables/disables the plot curve from changing it's title when the source data changes.
|
| |
| void | copySource (const CubePlotCurve &other) |
| | This copies the source data from another CubePlotCurve.
|
| |
| void | setSource (CubeViewport *cvp, QList< QPoint > screenPoints, int band=-1) |
| | Tell this plot curve from where its data originated.
|
| |
| void | setSource (QList< CubeViewport * > cvps, QList< QList< QPoint > > screenPoints, QList< int > band) |
| |
| void | attachMarkers () |
| | After attaching this curve to a plot, due to an inheritance/implementation complication with qwt the markers will remain detached until they are recreated.
|
| |
| QColor | color () const |
| | This method returns the color of the curve.
|
| |
| QwtSymbol * | markerSymbol () const |
| | This method returns the shape of the markers.
|
| |
| Units | xUnits () const |
| | Get the units of the x-axis double data.
|
| |
| Units | yUnits () const |
| | Get the units of the y-axis double data.
|
| |
| void | setColor (const QColor &color) |
| | Set the color of this curve and it's markers.
|
| |
| void | setData (QwtSeriesData< QPointF > *data) |
| | This method sets the data for the curve, then sets the value for the markers associated with the curve.
|
| |
| void | setPen (const QPen &pen) |
| | Sets the plot pen to the passed-in pen.
|
| |
| void | setMarkerSymbol (QwtSymbol::Style style) |
| | This method sets the shape of the markers.
|
| |
| void | setMarkerVisible (bool visible) |
| | This method sets the visibility states of the markers at each value point.
|
| |
This is a plot curve with information relating it to a particular cube or region of a cube.
This class was created specifically for use with the qview plot tools (AbstractPlotTool). This was formerly known as PlotToolCurve. With this class the programmer can set the cube view port that the curve is associated with along with the vertices on the viewport of which the curve gets it data. With this information, the plot curve can rename itself and paint its origin points onto cube viewports.
- Author
- ????-??-?? Stacy Alley
| void Isis::PlotCurve::attachMarkers |
( |
| ) |
|
|
inherited |
After attaching this curve to a plot, due to an inheritance/implementation complication with qwt the markers will remain detached until they are recreated.
This forces the markers to be updated immediately.
Please always call this method after attaching this curve to a plot.
Referenced by Isis::PlotWindow::add().
| void Isis::CubePlotCurve::paint |
( |
CubeViewport * | vp, |
|
|
QPainter * | painter ) |