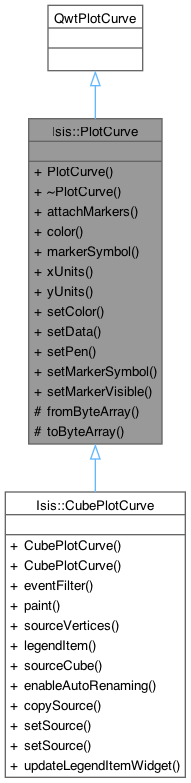
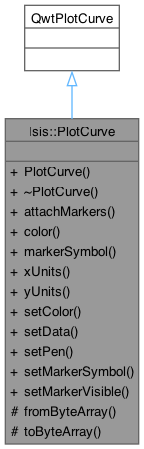
#include <PlotCurve.h>
|
| | PlotCurve (Units xUnits, Units yUnits) |
| | Constructs and instance of a PlotCurve with some default properties.
|
| |
| | ~PlotCurve () |
| |
| void | attachMarkers () |
| | After attaching this curve to a plot, due to an inheritance/implementation complication with qwt the markers will remain detached until they are recreated.
|
| |
| QColor | color () const |
| | This method returns the color of the curve.
|
| |
| QwtSymbol * | markerSymbol () const |
| | This method returns the shape of the markers.
|
| |
| Units | xUnits () const |
| | Get the units of the x-axis double data.
|
| |
| Units | yUnits () const |
| | Get the units of the y-axis double data.
|
| |
| void | setColor (const QColor &color) |
| | Set the color of this curve and it's markers.
|
| |
| void | setData (QwtSeriesData< QPointF > *data) |
| | This method sets the data for the curve, then sets the value for the markers associated with the curve.
|
| |
| void | setPen (const QPen &pen) |
| | Sets the plot pen to the passed-in pen.
|
| |
| void | setMarkerSymbol (QwtSymbol::Style style) |
| | This method sets the shape of the markers.
|
| |
| void | setMarkerVisible (bool visible) |
| | This method sets the visibility states of the markers at each value point.
|
| |
|
| QByteArray | fromByteArray (const QByteArray &classData) |
| | Construct the plot curve given the past results of toByteArray(...).
|
| |
| QByteArray | toByteArray () const |
| |
◆ Units
These are all the possible units for the x or y data in a plot curve.
We want these in order to have type checking when moving curves around - it's theoretically possible to even utilize the right y axis automatically when you put mismatched plot curve y data into the same plot. All of this and more requires knowing your data's units.
| Enumerator |
|---|
| Unknown | The data units are not yet known.
Please avoid using this if at all possible.
|
| Band | The data is a band number.
|
| CubeDN | The data is a Cube DN value.
|
| Elevation | The data is an elevation (in meters).
|
| Percentage | The data is a percentage (0-100).
|
| PixelNumber | The data is a pixel #.
For example, it's the nth pixel along a line.
|
| Meters | The data is in meters.
For example, it's the nth meter along a line.
|
| Kilometers | The data is in kilometers.
For example, it's the nth kilometer along a line.
|
| Wavelength | The data is a wavelength.
This is usually associated with a band and comes from the band bin group.
|
◆ PlotCurve()
| Isis::PlotCurve::PlotCurve |
( |
Units | xUnits, |
|
|
Units | yUnits ) |
◆ ~PlotCurve()
| Isis::PlotCurve::~PlotCurve |
( |
| ) |
|
◆ attachMarkers()
| void Isis::PlotCurve::attachMarkers |
( |
| ) |
|
After attaching this curve to a plot, due to an inheritance/implementation complication with qwt the markers will remain detached until they are recreated.
This forces the markers to be updated immediately.
Please always call this method after attaching this curve to a plot.
Referenced by Isis::PlotWindow::add().
◆ color()
| QColor Isis::PlotCurve::color |
( |
| ) |
const |
◆ fromByteArray()
| QByteArray Isis::PlotCurve::fromByteArray |
( |
const QByteArray & | classData | ) |
|
|
protected |
◆ markerSymbol()
| QwtSymbol * Isis::PlotCurve::markerSymbol |
( |
| ) |
const |
This method returns the shape of the markers.
- Returns
- QwtSymbol *
◆ setColor()
| void Isis::PlotCurve::setColor |
( |
const QColor & | color | ) |
|
◆ setData()
| void Isis::PlotCurve::setData |
( |
QwtSeriesData< QPointF > * | data | ) |
|
◆ setMarkerSymbol()
| void Isis::PlotCurve::setMarkerSymbol |
( |
QwtSymbol::Style | style | ) |
|
◆ setMarkerVisible()
| void Isis::PlotCurve::setMarkerVisible |
( |
bool | visible | ) |
|
This method sets the visibility states of the markers at each value point.
- Parameters
-
| visible | True to show markers, false to hide |
◆ setPen()
| void Isis::PlotCurve::setPen |
( |
const QPen & | pen | ) |
|
◆ toByteArray()
| QByteArray Isis::PlotCurve::toByteArray |
( |
| ) |
const |
|
protected |
◆ xUnits()
◆ yUnits()
The documentation for this class was generated from the following files:
- /Users/chkim/repos/ISIS3/isis/src/qisis/objs/PlotCurve/PlotCurve.h
- /Users/chkim/repos/ISIS3/isis/src/qisis/objs/PlotCurve/PlotCurve.cpp