 |
Isis 3 Programmer Reference
|
|
Isis 3 Programmer Reference
|
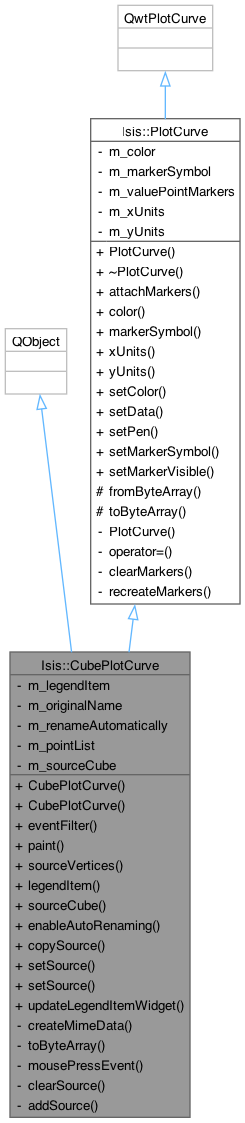
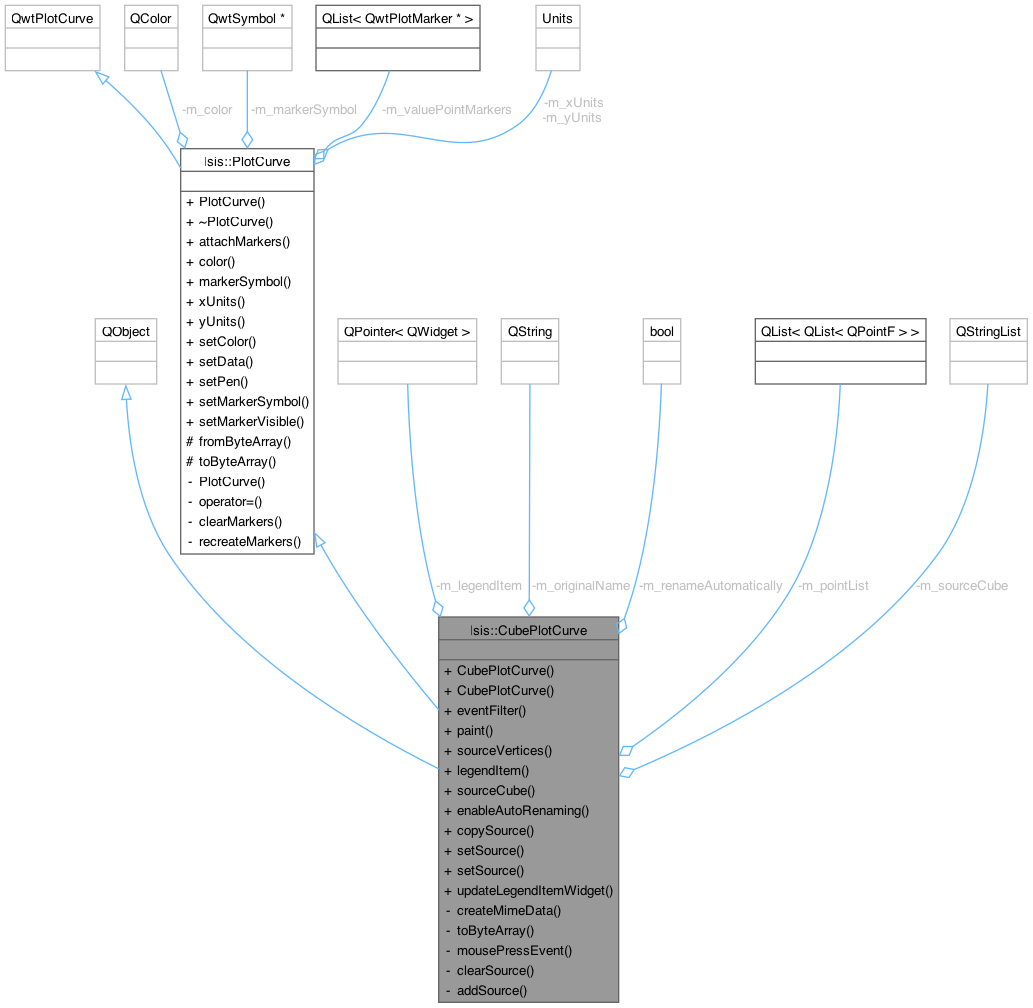
This is a plot curve with information relating it to a particular cube or region of a cube. More...
#include <CubePlotCurve.h>
Public Types | |
| enum | Units { Unknown , Band , CubeDN , Elevation , Percentage , PixelNumber , Meters , Kilometers , Wavelength } |
| These are all the possible units for the x or y data in a plot curve. More... | |
Public Slots | |
| void | updateLegendItemWidget (QWidget *legendItem) |
| This creates a legend item and overrides events from it. | |
Signals | |
| void | needsRepaint () |
| This is emitted when the curve is modified in such a way that it would paint a viewport differently. | |
| void | removing () |
| This is emitted just before the cube plot curve is deleted. | |
Public Member Functions | |
| CubePlotCurve (Units xUnits, Units yUnits) | |
| This constructs a CubePlotCurve... a subclass of PlotCurve. | |
| CubePlotCurve (const QByteArray &parentAndChildData) | |
| Construct the plot tool curve given the past results of toByteArray(...). | |
| bool | eventFilter (QObject *o, QEvent *e) |
| This will start the drag & drop operation for these curves. | |
| void | paint (CubeViewport *vp, QPainter *painter) |
| Use information inside of the plot curve to paint onto a cube viewport. | |
| QList< QList< QPointF > > | sourceVertices () const |
| This method returns a list of points which are the vertices of the selected area (by the rubberband) on the cvp. | |
| virtual QWidget * | legendItem () const |
| This method is necessary for getting the correct (event filter altered) legend item. | |
| QStringList | sourceCube () const |
| This method returns the cube view port associated with the curve. | |
| void | enableAutoRenaming (bool) |
| This enables/disables the plot curve from changing it's title when the source data changes. | |
| void | copySource (const CubePlotCurve &other) |
| This copies the source data from another CubePlotCurve. | |
| void | setSource (CubeViewport *cvp, QList< QPoint > screenPoints, int band=-1) |
| Tell this plot curve from where its data originated. | |
| void | setSource (QList< CubeViewport * > cvps, QList< QList< QPoint > > screenPoints, QList< int > band) |
| void | attachMarkers () |
| After attaching this curve to a plot, due to an inheritance/implementation complication with qwt the markers will remain detached until they are recreated. | |
| QColor | color () const |
| This method returns the color of the curve. | |
| QwtSymbol * | markerSymbol () const |
| This method returns the shape of the markers. | |
| Units | xUnits () const |
| Get the units of the x-axis double data. | |
| Units | yUnits () const |
| Get the units of the y-axis double data. | |
| void | setColor (const QColor &color) |
| Set the color of this curve and it's markers. | |
| void | setData (QwtSeriesData< QPointF > *data) |
| This method sets the data for the curve, then sets the value for the markers associated with the curve. | |
| void | setPen (const QPen &pen) |
| Sets the plot pen to the passed-in pen. | |
| void | setMarkerSymbol (QwtSymbol::Style style) |
| This method sets the shape of the markers. | |
| void | setMarkerVisible (bool visible) |
| This method sets the visibility states of the markers at each value point. | |
Protected Member Functions | |
| QByteArray | fromByteArray (const QByteArray &classData) |
| Construct the plot curve given the past results of toByteArray(...). | |
Private Member Functions | |
| QMimeData * | createMimeData () const |
| This converts the plot curve into a binary, clipboard-compatible storage format (QMimeData). | |
| QByteArray | toByteArray () const |
| Serialize this plot curve into a binary byte array. | |
| void | mousePressEvent (QMouseEvent *e) |
| Handle various events on the legend item. | |
| void | clearSource () |
| void | addSource (CubeViewport *cvp, QList< QPoint > screenPoints, int band=-1) |
| void | clearMarkers () |
| void | recreateMarkers () |
Private Attributes | |
| QPointer< QWidget > | m_legendItem |
| This is the widget legend item associated with this curve. | |
| QString | m_originalName |
| This is the curve's name before any automatic renaming happened. | |
| bool | m_renameAutomatically |
| This indicates if we are allowed to modify the title of this curve when the source (origin) data changes. | |
| QList< QList< QPointF > > | m_pointList |
| List of vertices in sample,line coordinates from the rubber band. | |
| QStringList | m_sourceCube |
| The cube that the data is coming from. | |
| QColor | m_color |
| QwtSymbol * | m_markerSymbol |
| Marker's styles. | |
| QList< QwtPlotMarker * > | m_valuePointMarkers |
| Units | m_xUnits |
| Units | m_yUnits |
This is a plot curve with information relating it to a particular cube or region of a cube.
This class was created specifically for use with the qview plot tools (AbstractPlotTool). This was formerly known as PlotToolCurve. With this class the programmer can set the cube view port that the curve is associated with along with the vertices on the viewport of which the curve gets it data. With this information, the plot curve can rename itself and paint its origin points onto cube viewports.
2012-01-18 Steven Lambright and Tracie Sucharski - Renamed class to CubePlotCurve. Changed functionality dramatically to support a new plotting infrastructure.
2012-01-20 Steven Lambright and Jai Rideout - Completed documentation.
2012-01-30 Steven Lambright - Fixed a bug added when the legendItem() method was removed. This method is necessary. Fixes #688.
2012-03-14 Tracie Sucharski - Added functionality for multiple viewports as a source for plots.
2014-07-02 Ian Humphrey - Added comment for executing configure dialog. References #2089.
Definition at line 53 of file CubePlotCurve.h.
|
inherited |
These are all the possible units for the x or y data in a plot curve.
We want these in order to have type checking when moving curves around - it's theoretically possible to even utilize the right y axis automatically when you put mismatched plot curve y data into the same plot. All of this and more requires knowing your data's units.
| Enumerator | |
|---|---|
| Unknown | The data units are not yet known. Please avoid using this if at all possible. |
| Band | The data is a band number. |
| CubeDN | The data is a Cube DN value. |
| Elevation | The data is an elevation (in meters). |
| Percentage | The data is a percentage (0-100). |
| PixelNumber | The data is a pixel #. For example, it's the nth pixel along a line. |
| Meters | The data is in meters. For example, it's the nth meter along a line. |
| Kilometers | The data is in kilometers. For example, it's the nth kilometer along a line. |
| Wavelength | The data is a wavelength. This is usually associated with a band and comes from the band bin group. |
Definition at line 54 of file PlotCurve.h.
This constructs a CubePlotCurve... a subclass of PlotCurve.
This class was created specifically for use with the plot tools. With this class the programmer can set the cube view port that the curve is associated with along with the vertices on the cvp of which the curve gets it data.
| xUnits | The units that the x-axis data is in |
| yUnits | The units that the x-axis data is in |
Definition at line 49 of file CubePlotCurve.cpp.
References m_legendItem, and m_renameAutomatically.
| Isis::CubePlotCurve::CubePlotCurve | ( | const QByteArray & | parentAndChildData | ) |
Construct the plot tool curve given the past results of toByteArray(...).
This is used for copy/paste and drag/drop.
| parentAndChildData | A serialized, binary representation of an instance of this class. |
Definition at line 63 of file CubePlotCurve.cpp.
References Isis::PlotCurve::fromByteArray(), m_legendItem, m_pointList, m_sourceCube, and Isis::IException::Programmer.
|
private |
Definition at line 278 of file CubePlotCurve.cpp.
|
inherited |
After attaching this curve to a plot, due to an inheritance/implementation complication with qwt the markers will remain detached until they are recreated.
This forces the markers to be updated immediately.
Please always call this method after attaching this curve to a plot.
Definition at line 45 of file PlotCurve.cpp.
|
privateinherited |
Definition at line 348 of file PlotCurve.cpp.
|
private |
Definition at line 263 of file CubePlotCurve.cpp.
|
inherited |
This method returns the color of the curve.
Definition at line 55 of file PlotCurve.cpp.
Referenced by Isis::PlotWindowBestFitDialog::createBestFitLine(), paint(), and Isis::PlotCurve::setColor().
| void Isis::CubePlotCurve::copySource | ( | const CubePlotCurve & | other | ) |
This copies the source data from another CubePlotCurve.
This curve will now act as if it has the same exact source data as the other curve.
| other | The curve with the source (origination) data to copy. |
Definition at line 256 of file CubePlotCurve.cpp.
References m_pointList, m_sourceCube, and needsRepaint().
|
private |
This converts the plot curve into a binary, clipboard-compatible storage format (QMimeData).
The format is 'application/isis3-plot-curve'.
Definition at line 362 of file CubePlotCurve.cpp.
References toByteArray().
Referenced by mousePressEvent().
| void Isis::CubePlotCurve::enableAutoRenaming | ( | bool | allowed | ) |
This enables/disables the plot curve from changing it's title when the source data changes.
This is enabled by default and typically disabled when a user manually renames a curve.
| allowed | True for automatic renaming, false to preserve curve title |
Definition at line 245 of file CubePlotCurve.cpp.
References m_renameAutomatically.
| bool Isis::CubePlotCurve::eventFilter | ( | QObject * | o, |
| QEvent * | e ) |
This will start the drag & drop operation for these curves.
| o | The object that the event relates to. This is usually the legend item, but some children install their own event filters for other objects. |
| e | The event that occurred on the given object. |
Definition at line 137 of file CubePlotCurve.cpp.
References mousePressEvent().
|
protectedinherited |
Construct the plot curve given the past results of toByteArray(...).
This is used for copy/paste and drag/drop.
Definition at line 144 of file PlotCurve.cpp.
References Isis::PlotCurve::m_markerSymbol, Isis::IException::Programmer, Isis::PlotCurve::setColor(), Isis::PlotCurve::setData(), and Isis::PlotCurve::setPen().
Referenced by CubePlotCurve().
|
virtual |
This method is necessary for getting the correct (event filter altered) legend item.
Without this, drag & drop and context menus do not work.
Definition at line 222 of file CubePlotCurve.cpp.
References m_legendItem.
Referenced by updateLegendItemWidget().
|
inherited |
This method returns the shape of the markers.
Definition at line 65 of file PlotCurve.cpp.
References Isis::PlotCurve::m_markerSymbol.
|
private |
Handle various events on the legend item.
This will only be called for the legend item's events and handles drag & drop, context menus and similar actions. Basically all user interaction with legend items happen here.
| event | The event which happened on the legend item. |
Definition at line 423 of file CubePlotCurve.cpp.
References createMimeData(), Isis::FileName::expanded(), m_legendItem, needsRepaint(), removing(), and Isis::PlotCurve::setColor().
Referenced by eventFilter().
|
signal |
This is emitted when the curve is modified in such a way that it would paint a viewport differently.
Referenced by copySource(), and mousePressEvent().
| void Isis::CubePlotCurve::paint | ( | CubeViewport * | vp, |
| QPainter * | painter ) |
Use information inside of the plot curve to paint onto a cube viewport.
This paints the originating data points, in the color of the curve, onto the viewport. This will not paint onto unrelated cube viewports.
| vp | The viewport we're going to potentially paint onto |
| painter | The painter to use for painting onto the viewport |
Definition at line 169 of file CubePlotCurve.cpp.
References Isis::PlotCurve::color(), m_sourceCube, and sourceVertices().
|
privateinherited |
Definition at line 358 of file PlotCurve.cpp.
|
signal |
This is emitted just before the cube plot curve is deleted.
This is used to queue the deletes to happen at a safe time.
Referenced by mousePressEvent().
|
inherited |
Set the color of this curve and it's markers.
This color will override the pen's color always.
| color | The color of this curve. |
Definition at line 96 of file PlotCurve.cpp.
References Isis::PlotCurve::color(), and Isis::PlotCurve::setPen().
Referenced by Isis::PlotCurve::fromByteArray(), and mousePressEvent().
|
inherited |
This method sets the data for the curve, then sets the value for the markers associated with the curve.
| data |
Definition at line 108 of file PlotCurve.cpp.
Referenced by Isis::PlotCurve::fromByteArray().
|
inherited |
This method sets the shape of the markers.
| style |
Definition at line 119 of file PlotCurve.cpp.
References Isis::PlotCurve::m_markerSymbol.
|
inherited |
This method sets the visibility states of the markers at each value point.
| visible | True to show markers, false to hide |
Definition at line 130 of file PlotCurve.cpp.
|
inherited |
Sets the plot pen to the passed-in pen.
| pen |
Definition at line 338 of file PlotCurve.cpp.
Referenced by Isis::PlotCurve::fromByteArray(), and Isis::PlotCurve::setColor().
| void Isis::CubePlotCurve::setSource | ( | CubeViewport * | cvp, |
| QList< QPoint > | screenPoints, | ||
| int | band = -1 ) |
Tell this plot curve from where its data originated.
If you set a source, you must keep it up to date. Any time the data in the curve changes, you should be calling this method again.
| cvp | The viewport from which this curve's data came from |
| screenPoints | The pertinent points on the viewport from which this curve's data came from. |
| band | The band of the cube inside of said viewport from which this curve's data came from. |
Definition at line 321 of file CubePlotCurve.cpp.
| void Isis::CubePlotCurve::setSource | ( | QList< CubeViewport * > | cvps, |
| QList< QList< QPoint > > | screenPoints, | ||
| QList< int > | band ) |
Definition at line 330 of file CubePlotCurve.cpp.
| QStringList Isis::CubePlotCurve::sourceCube | ( | ) | const |
This method returns the cube view port associated with the curve.
Definition at line 233 of file CubePlotCurve.cpp.
References m_sourceCube.
This method returns a list of points which are the vertices of the selected area (by the rubberband) on the cvp.
Definition at line 211 of file CubePlotCurve.cpp.
References m_pointList.
Referenced by paint().
|
private |
Serialize this plot curve into a binary byte array.
This is useful for storing the curve on the clipboard or in a drag & drop event.
Definition at line 376 of file CubePlotCurve.cpp.
References m_pointList, and m_sourceCube.
Referenced by createMimeData().
|
slot |
This creates a legend item and overrides events from it.
Definition at line 343 of file CubePlotCurve.cpp.
References legendItem(), and m_legendItem.
|
inherited |
Get the units of the x-axis double data.
Definition at line 75 of file PlotCurve.cpp.
Referenced by Isis::PlotWindowBestFitDialog::createBestFitLine(), and Isis::PlotCurve::PlotCurve().
|
inherited |
Get the units of the y-axis double data.
Definition at line 85 of file PlotCurve.cpp.
Referenced by Isis::PlotWindowBestFitDialog::createBestFitLine(), and Isis::PlotCurve::PlotCurve().
|
privateinherited |
Definition at line 123 of file PlotCurve.h.
|
private |
This is the widget legend item associated with this curve.
Definition at line 99 of file CubePlotCurve.h.
Referenced by CubePlotCurve(), CubePlotCurve(), legendItem(), mousePressEvent(), and updateLegendItemWidget().
|
privateinherited |
Marker's styles.
Definition at line 124 of file PlotCurve.h.
Referenced by Isis::PlotCurve::fromByteArray(), Isis::PlotCurve::markerSymbol(), Isis::PlotCurve::PlotCurve(), and Isis::PlotCurve::setMarkerSymbol().
|
private |
This is the curve's name before any automatic renaming happened.
Definition at line 102 of file CubePlotCurve.h.
List of vertices in sample,line coordinates from the rubber band.
Definition at line 111 of file CubePlotCurve.h.
Referenced by copySource(), CubePlotCurve(), sourceVertices(), and toByteArray().
|
private |
This indicates if we are allowed to modify the title of this curve when the source (origin) data changes.
Definition at line 108 of file CubePlotCurve.h.
Referenced by CubePlotCurve(), and enableAutoRenaming().
|
private |
The cube that the data is coming from.
Definition at line 114 of file CubePlotCurve.h.
Referenced by copySource(), CubePlotCurve(), paint(), sourceCube(), and toByteArray().
|
privateinherited |
Definition at line 125 of file PlotCurve.h.
|
privateinherited |
Definition at line 126 of file PlotCurve.h.
|
privateinherited |
Definition at line 127 of file PlotCurve.h.