

specdivfilter
Apply a spectral division filter
Categories
Related Applications to Previous Versions of ISIS
This program replaces the following application existing in previous versions of ISIS:- boxfilter
Related Objects and Documents
Applications
History
| Stacy Alley | 2008-09-02 | Original version |
| Mackenzie Boyd | 2009-06-05 | Modified documentation, added error checking for the number of bands, and added examples |
Parameters
Files
| Type | cube |
|---|---|
| File Mode | input |
| Filter | *.cub |
| Type | cube |
|---|---|
| File Mode | output |
| Pixel Type | real |
| Filter | *.cub |
Boxcar Size
| Type | integer |
|---|---|
| Minimum | 1 (inclusive) |
| Odd | This value must be an odd number |
Boxcar Settings
| Type | double |
|---|---|
| Internal Default | Use all pixels |
| Less Than | HIGH |
| Type | double |
|---|---|
| Internal Default | Use all pixels |
| Greater Than | LOW |
Example 1
Example of usage of the spectral division filter.
Command Line
specdivfilter
          from=/work1/mboyd/CM_1514302573_1.cub to=/work1/mboyd/postlow.cub
          bands=15
GUI Screenshot
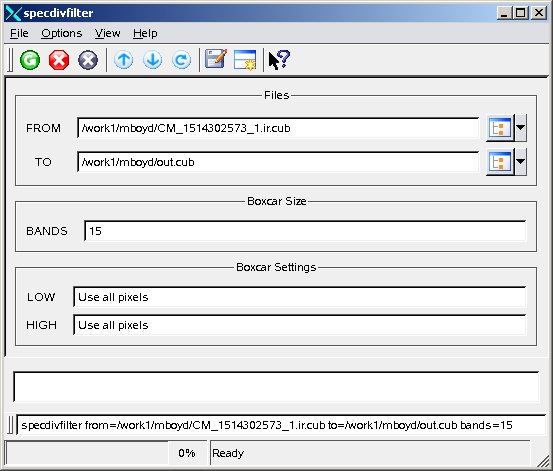
Example GUI
This program's GUIScreenshot of the GUI with parameters set to perform the specdivision filter with a 15 band boxcar on the image CM_1514302573_1.ir.cub.
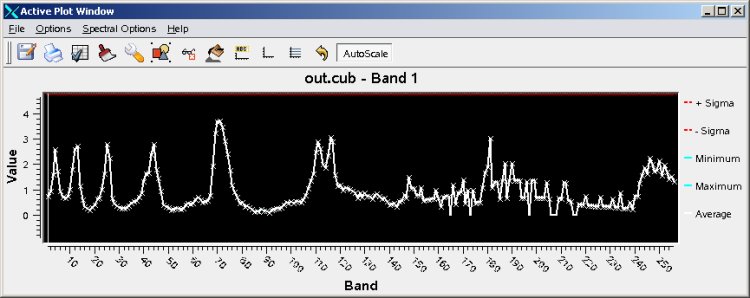
Input Image
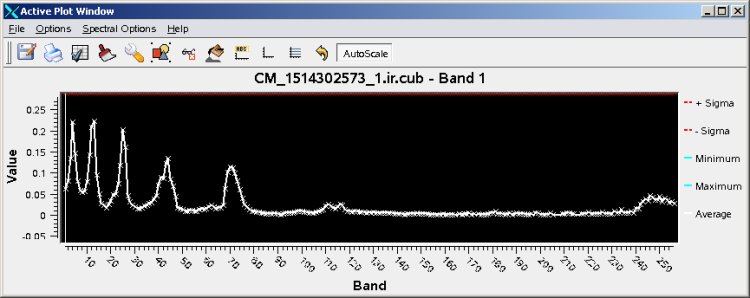
Input image spectral graph before specdivfilter
The image graph before the filter
Parameter Name:
FROM
This is the spectral plot of the center point of the image, (32, 32), and shows all bands, 1- 256. No filter has been applied, and the graph clearly shows how the value of line 32 sample 32 differs from band to band.
Output Image
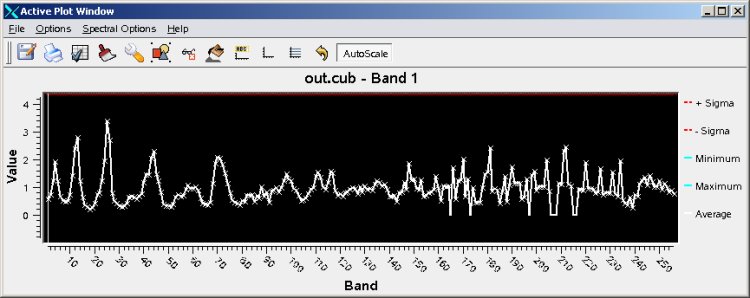
Output image spectral graph after being filtered
The image graph after the filter
Parameter Name:
TO
This is the image after the filter. First note the change in scale, everything has been amplified. Even in the apparent flat area small differences have been amplified.
Example 2
Example of usage of the spectral division filter.
Command Line
specdivfilter
          from=/work1/mboyd/CM_1514302573_1.cub to=/work1/mboyd/postlow.cub
          bands=61
GUI Screenshot

Example GUI
This program's GUIScreenshot of the GUI with parameters set to perform the spechighpass filter with a 61 band boxcar on the image CM_1514302573_1.ir.cub.
Input Image
Input image spectral graph before spectral division filter
The image graph before the filter
Parameter Name:
FROM
This is the spectral plot of the center point of the image, (32, 32), and shows all bands, 1- 256. No averaging or amplification has been applied.
Output Image
Output image spectral graph after being filtered
The image graph after the filter
Parameter Name:
TO
This is the image after the filter. The amplification is clear immediately from the change in scale necessary to show the new values. All differences have been amplified, but smaller differences have increased more significantly than large differences.