

speclowpass
Apply spectral low pass filter to a cube
Categories
Related Applications to Previous Versions of ISIS
This program replaces the following application existing in previous versions of ISIS:- boxfilter
Related Objects and Documents
Applications
History
| Stacy Alley | 2008-09-02 | Original version |
| Mackenzie Boyd | 2009-06-09 | Modified documentation, added exception handling for too many bands, modified examples |
Parameters
Files
| Type | cube |
|---|---|
| File Mode | input |
| Filter | *.cub |
| Type | cube |
|---|---|
| File Mode | output |
| Filter | *.cub |
Boxcar Size
| Type | integer |
|---|---|
| Minimum | 1 (inclusive) |
| Odd | This value must be an odd number |
Boxcar Settings
| Type | double |
|---|---|
| Internal Default | Use all pixels |
| Less Than | HIGH |
| Type | double |
|---|---|
| Internal Default | Use all pixels |
| Greater Than | LOW |
Example 1
Example of usage of the spectral lowpass filter.
Command Line
speclowpass
          from=/work1/mboyd/CM_1514302573_1.cub to=/work1/mboyd/postlow.cub
          bands=5
GUI Screenshot
Example GUI
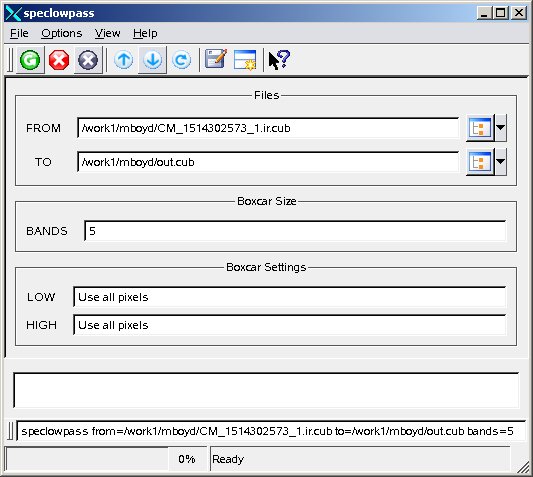
This program's GUIScreenshot of the GUI wit h parameters set to perform the spechighpass filter with a 5 band boxcar on the image CM_1514302573_1.ir.cub.
Input Image
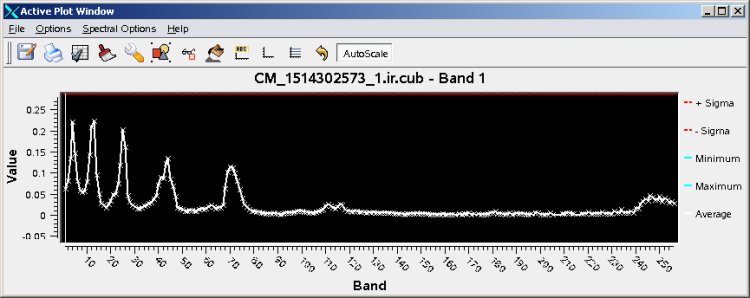
Input image spectral graph before speclowpass filter
The image graph before the filter
Parameter Name:
FROM
This is the spectral plot of the center point of the image, (32, 32), and shows all bands, 1- 256. No averaging has been applied, this is clear partialy because of th extreme peaks visible in the first half. The peaks are related to values which differ significantly from the bands around them.
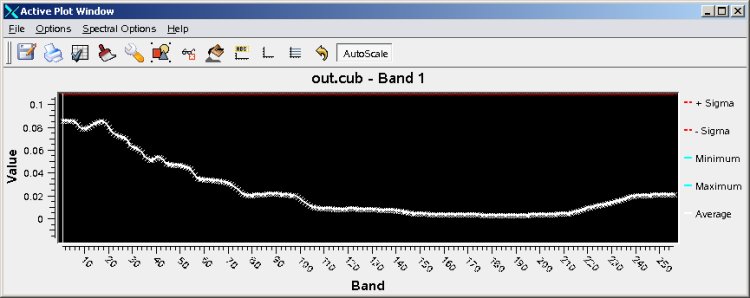
Output Image
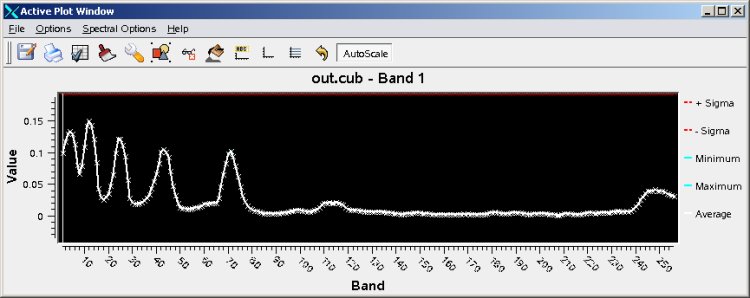
Output image spectral graph after being filtered
The image graph after the filter
Parameter Name:
TO
This is the image after the filter. Although there are still peaks, everything has been smoothed. In the before image the peaks were sharp where as now they are more curved. Differences have been leveled out to some extent.
Example 2
Example of usage of the spectral lowpass filter.
Command Line
speclowpass
          from=/work1/mboyd/CM_1514302573_1.cub to=/work1/mboyd/postlow.cub
          bands=61
GUI Screenshot
Example GUI
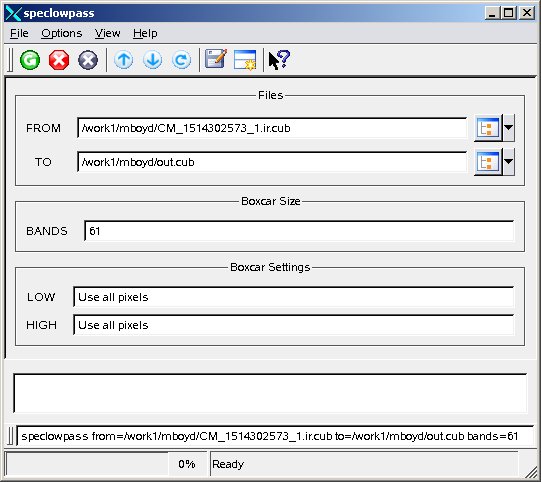
This program's GUIScreenshot of the GUI with parameters set to perform the spechighpass filter with a 61 band boxcar on the image CM_1514302573_1.ir.cub.
Input Image
Input image spectral graph before speclowpass filter
The image graph before the filter
Parameter Name:
FROM
This is the spectral plot of the center point of the image, (32, 32), and shows all bands, 1- 256. No averaging has been applied, this is clear partialy because of th extreme peaks visible in the first half. The peaks are related to values which differ significantly from the bands around them.
Output Image
Output image spectral graph after being filtered
The image graph after the filter
Parameter Name:
TO
This is the image after the filter. As is very clear, the averaging has turned sharp peaks into a smooth slope and small bumps into nothing. All bands in the image are now muchmore similar to each ohter than they were before. Also note that the scale has changed significantly.