Isis Developer Reference
Isis::PlotWindow Class Reference

#include <PlotWindow.h>

Inheritance diagram for Isis::PlotWindow:
Inheritance graph
Collaboration diagram for Isis::PlotWindow:
Collaboration graph

Public Types

enum  MenuOptions {
  ShowHideMarkersMenuOption = 1 , ShowHideCurvesMenuOption = 2 , ShowTableMenuOption = 4 , SaveMenuOption = 8 ,
  PrintMenuOption = 16 , TrackMenuOption = 32 , BackgroundSwitchMenuOption = 64 , ShowHideGridMenuOption = 128 ,
  RenameLabelsMenuOption = 256 , SetDisplayRangeMenuOption = 512 , ResetScaleMenuOption = 1024 , ClearPlotMenuOption = 2048 ,
  DefaultHelpMenuOption = 4096 , LineFitMenuOption = 8192 , ConfigurePlotMenuOption = 16384 , AllMenuOptions
}
 There is a menu option for everything in the plot window's menu. More...
 

Public Slots

void clearPlot ()
 This method completely clears the plot of all plot items.
 
void configurePlotCurves ()
 This method creates a CubePlotCurveConfigureDialog object.
 
void createBestFitLine ()
 This method prompts the user to select the best fit line criterea.
 
void printPlot ()
 Provides printing support of the plot image.
 
void changePlotLabels ()
 This method creates the dialog box which allows the user to relabel the plot window.
 
void savePlot ()
 This method allows the user to save the plot as a png, jpg, or tif image file.
 
void setDefaultRange ()
 Resets the x/y min/max to the defaults.
 
void setLabels ()
 Makes the user specified changes to the plot labels.
 
void setUserValues ()
 This method sets the scale for the axis according to the user specified numbers.
 
void showHideAllMarkers ()
 Shows/Hides all the markers(symbols)
 
void showHideAllCurves ()
 This method shows or hides all of the curves in the plotWindow.
 
void resetScale ()
 Sets plot scale back to the defaults.
 
void showHideGrid ()
 This method hides/shows the grid on the plotWindow and changes the text for the action.
 
void showHelp ()
 This method creates and shows the help dialog box for the plot window.
 
void showTable ()
 This method is called from the showTable action on the tool bar There are some checks done to make sure there are data to fill the table.
 
void switchBackground ()
 This method toggles the plot background color between black and white.
 
void trackerEnabled ()
 Enables the plot mouse tracker.
 
void scheduleFillTable ()
 Fills in the table with the data from the current curves in the plotWindow once all current actions/activations are done.
 
void fillTable ()
 Fills in the table with the data from the current curves in the plotWindow immediately.
 

Signals

void closed ()
 Emitted when there is a close event on this window that will be accepted.
 
void plotChanged ()
 Emitted every time there is a change to the plot window.
 
void requestFillTable ()
 

Public Member Functions

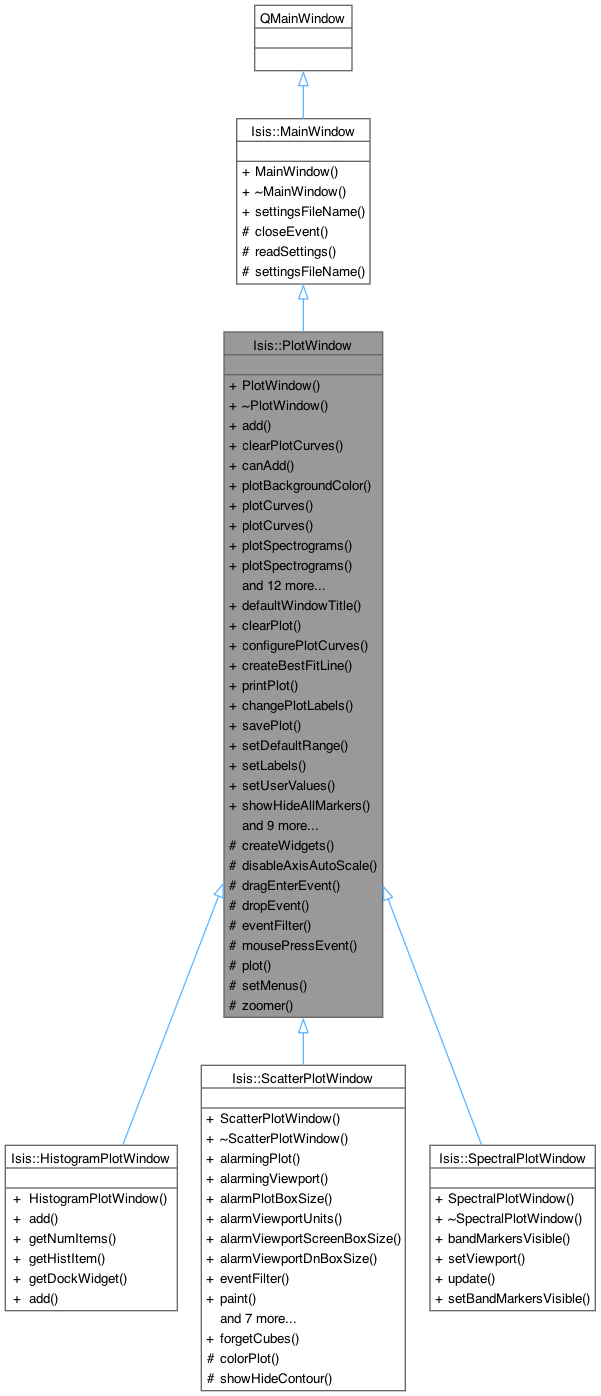
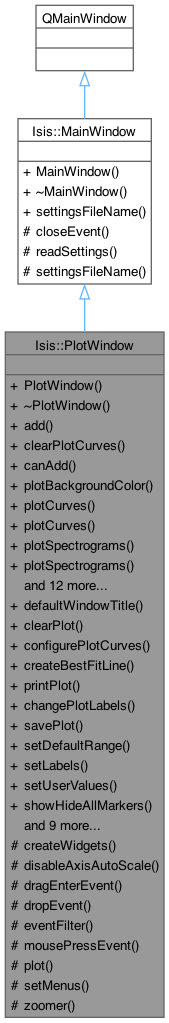
 PlotWindow (QString title, PlotCurve::Units xAxisUnits, PlotCurve::Units yAxisUnits, QWidget *parent, MenuOptions optionsToProvide=AllMenuOptions)
 This constructs a plot window.
 
 ~PlotWindow ()
 
virtual void add (CubePlotCurve *pc)
 This method adds the curves to the plot.
 
virtual void clearPlotCurves ()
 This method also clears the plot of all plot items, but does not call the table delete stuff This method is called from plotTool each time the changePlot() method is called.
 
bool canAdd (CubePlotCurve *curveToTest) const
 This method tests whethere or not a CubePlotCurve can be successfully added to this window.
 
QColor plotBackgroundColor () const
 Returns the plot's background color.
 
QList< CubePlotCurve * > plotCurves ()
 Get a comprehensive list of the plot curves inside of this plot window, excluding plot curves that are in the process of being removed.
 
QList< const CubePlotCurve * > plotCurves () const
 Get a comprehensive const list of the plot curves inside of this plot window, excluding plot curves that are in the process of being removed.
 
QList< QwtPlotSpectrogram * > plotSpectrograms ()
 Get a comprehensive list of the scatter plots (spectrograms) inside of this plot window.
 
QList< const QwtPlotSpectrogram * > plotSpectrograms () const
 Get a comprehensive const list of the scatter plots (spectrograms) inside of this plot window.
 
QString plotTitle () const
 Returns the plot title.
 
bool userCanAddCurves () const
 Ask if a user action can add this curve to this window in general.
 
PlotCurve::Units xAxisUnits () const
 This is the data-type of the curves' x data in this plot window.
 
PlotCurve::Units yAxisUnits () const
 This is the data-type of the curves' y data in this plot window.
 
virtual void paint (MdiCubeViewport *vp, QPainter *painter)
 Paint plot curve information onto the viewport.
 
void replot ()
 Reset the scale of the plot, replot it and emit plot changed.
 
void setAxisLabel (int axisId, QString title)
 Sets the plots given axis title to the given string.
 
void setPlotBackground (QColor c)
 Sets the plot background color to the given color.
 
void setPlotTitle (QString pt)
 Sets the plot title to the given string.
 
void setUserCanAddCurves (bool)
 Allow or disallow users from manually putting curves into this plot window through either copy-and-paste or drag-and-drop.
 
void showWindow ()
 Shows the plot window, and raises it to the front of any overlapping sibling widgets.
 
virtual void update (MdiCubeViewport *activeViewport)
 This is provided to allow children to react to tool updates.
 

Static Public Member Functions

static QString defaultWindowTitle ()
 This is the typical suffix for plot windows, it's here in case we want to update all plot windows to have a different ending than just 'Plot' on them (for example, 'Plot Window').
 
static QString settingsFileName (QString objectTitle)
 

Protected Member Functions

void createWidgets (MenuOptions optionsToProvide)
 This method is called by the constructor to create the plot, legend.
 
void disableAxisAutoScale ()
 This turns off scaling the x/y axes automatically.
 
virtual void dragEnterEvent (QDragEnterEvent *event)
 When a user drags data into our plot window, we need to indicate whether or not this data is compatible with this window.
 
virtual void dropEvent (QDropEvent *event)
 This is called when a user drops data into our window.
 
virtual bool eventFilter (QObject *o, QEvent *e)
 This method filters the events of the objects it is connected to.
 
void mousePressEvent (QObject *object, QMouseEvent *e)
 This is a helper method for the eventFilter() method.
 
QwtPlotplot ()
 Get the plot encapsulated by this PlotWindow.
 
void setMenus (QList< QMenu * > menus, QList< QAction * > actions)
 Sets up the menus added from a parent object.
 
QwtPlotZoomer * zoomer ()
 Get this window's plot's zoomer.
 
QString settingsFileName () const
 
virtual void closeEvent (QCloseEvent *event)
 This method is overridden so that we can be sure to write the current settings of the Main window.
 
virtual void readSettings (QSize defaultSize=QSize())
 This method ensure that the settings get written even if the Main window was only hidden, not closed.
 

Detailed Description

Author
????-??-?? Stacy Alley

Member Enumeration Documentation

◆ MenuOptions

There is a menu option for everything in the plot window's menu.

This is provided so that you can enable/disable any given option.

Enumerator
ShowHideMarkersMenuOption 

This option is titled 'Hide All Symbols' which hides all markers.

ShowHideCurvesMenuOption 

This option is titled 'Hide All Curves' which makes all curves invisible.

ShowTableMenuOption 

This option brings up the table.

No table will be available without this option.

SaveMenuOption 

This option exports the plot into a standard image format.

No conversion to a standard image format file will be available without this option, but printing will still be available.

PrintMenuOption 

This option sends the plot to a printer.

TrackMenuOption 

This option enables mouse tracking on the plot area (displays next to the mouse which x/y point you are hovering over).

This option is by default disabled.

BackgroundSwitchMenuOption 

This option enables the ability for a user to change the background color of the plot from black to white.

ShowHideGridMenuOption 

This option enables the ability for a user to enable a grid over the plot area.

RenameLabelsMenuOption 

This option enables the ability for a user to change the x/y axis labels and plot title.

SetDisplayRangeMenuOption 

This option allows the user to set the x/y axis display value ranges.

ResetScaleMenuOption 

This option provides the user with an alternative zoom out button.

ClearPlotMenuOption 

This option allows the user to delete all of the data inside the plot.

If you don't want the user deleting a custom plot item, you should disable this option.

DefaultHelpMenuOption 

Not implemented.

LineFitMenuOption 

This option allows the user to create a best fit line for any of the scatter plot data or cube plot curve data in the window.

This allows the user to create new plot curves.

ConfigurePlotMenuOption 

This option allows the user to change the curve name, color, style size, and symbol of the curve.

AllMenuOptions 

This is all of the available menu options.

Constructor & Destructor Documentation

◆ PlotWindow()

Isis::PlotWindow::PlotWindow ( QString title,
PlotCurve::Units xAxisUnits,
PlotCurve::Units yAxisUnits,
QWidget * parent,
MenuOptions optionsToProvide = AllMenuOptions )

This constructs a plot window.

The plot window graphs any curve sent to it via the addPlotCurve() method.

Parameters
titleThe window title and default plot title
xAxisUnitsThe x-bottom axis data's units, which must match any curves' units that are added to this window.
yAxisUnitsThe y-left axis data's units, which must match any curves' units that are added to this window.
parentThe Qt parent widget
optionsToProvideA bit-flag containing information on which options to provide to the users.

References _FILEINFO_, Isis::PlotCurve::Band, createWidgets(), Isis::PlotCurve::CubeDN, Isis::PlotCurve::Elevation, fillTable(), Isis::PlotCurve::Kilometers, Isis::PlotCurve::Meters, Isis::PlotCurve::Percentage, Isis::PlotCurve::PixelNumber, plot(), plotChanged(), Isis::IException::Programmer, Isis::MainWindow::readSettings(), requestFillTable(), scheduleFillTable(), setPlotBackground(), setPlotTitle(), Isis::PlotCurve::Wavelength, xAxisUnits(), and yAxisUnits().

◆ ~PlotWindow()

Isis::PlotWindow::~PlotWindow ( )

References plotCurves().

Member Function Documentation

◆ add()

void Isis::PlotWindow::add ( CubePlotCurve * pc)
virtual

This method adds the curves to the plot.

Parameters
pc

Reimplemented in Isis::HistogramPlotWindow.

References canAdd(), fillTable(), plot(), plotChanged(), replot(), and resetScale().

Referenced by dropEvent().

◆ canAdd()

bool Isis::PlotWindow::canAdd ( CubePlotCurve * curveToTest) const

This method tests whethere or not a CubePlotCurve can be successfully added to this window.

Plot curves with mismatched X/Y data from the plot's x/y axis types can not be added to the window. This does not test whether or not a user is allowed to add the curve manually, just if the curve can be added programatically.

Parameters
curveToTestThe plot curve to test for compatibility with this window
Returns
True if the curve is compatible with this window, false otherwise

Referenced by add().

◆ changePlotLabels

void Isis::PlotWindow::changePlotLabels ( )
slot

This method creates the dialog box which allows the user to relabel the plot window.

References plot(), and setLabels().

◆ clearPlot

void Isis::PlotWindow::clearPlot ( )
slot

This method completely clears the plot of all plot items.

i.e. curves and markers, which also deletes the legend also calls the necessary method to delete the table stuff

References clearPlotCurves(), and Isis::TableMainWindow::table().

◆ clearPlotCurves()

void Isis::PlotWindow::clearPlotCurves ( )
virtual

This method also clears the plot of all plot items, but does not call the table delete stuff This method is called from plotTool each time the changePlot() method is called.

References replot().

Referenced by clearPlot().

◆ closed

void Isis::PlotWindow::closed ( )
signal

Emitted when there is a close event on this window that will be accepted.

Referenced by eventFilter().

◆ closeEvent()

void Isis::MainWindow::closeEvent ( QCloseEvent * event)
protectedvirtualinherited

This method is overridden so that we can be sure to write the current settings of the Main window.

Parameters
event

Reimplemented in Isis::TableMainWindow, and Isis::ViewportMainWindow.

Referenced by Isis::TableMainWindow::closeEvent(), and Isis::ViewportMainWindow::closeEvent().

◆ configurePlotCurves

void Isis::PlotWindow::configurePlotCurves ( )
slot

This method creates a CubePlotCurveConfigureDialog object.

When there are no curves in this PlotWindow, the dialog will not be created.

References plotChanged(), and plotCurves().

◆ createBestFitLine

void Isis::PlotWindow::createBestFitLine ( )
slot

This method prompts the user to select the best fit line criterea.

The PlotWindowBestFitDialog will create the best fit line automatically when the user asks for one, so we don't need to worry about doing any more than showing a dialog here.

References plot().

◆ createWidgets()

void Isis::PlotWindow::createWidgets ( MenuOptions optionsToProvide)
protected

This method is called by the constructor to create the plot, legend.

zoomer, and main window.

Parameters
optionsToProvideThis is a bit-flag containing information on which menu options to give the user/put in the GUI.

Referenced by PlotWindow().

◆ defaultWindowTitle()

QString Isis::PlotWindow::defaultWindowTitle ( )
static

This is the typical suffix for plot windows, it's here in case we want to update all plot windows to have a different ending than just 'Plot' on them (for example, 'Plot Window').

Returns
A string to be appended to your window title

Referenced by Isis::HistogramTool::createWindow(), Isis::SpatialPlotTool::createWindow(), and Isis::SpectralPlotTool::createWindow().

◆ disableAxisAutoScale()

void Isis::PlotWindow::disableAxisAutoScale ( )
protected

This turns off scaling the x/y axes automatically.

Use this if you have a very specific axis range you want to use, but keep in mind that users (potentially) have an option to re-enable axis auto scaling if they want to.

Referenced by Isis::ScatterPlotWindow::ScatterPlotWindow().

◆ dragEnterEvent()

void Isis::PlotWindow::dragEnterEvent ( QDragEnterEvent * event)
protectedvirtual

When a user drags data into our plot window, we need to indicate whether or not this data is compatible with this window.

This checks userCanAddCurve() on the drag & drop data and allows or disallowed the event accordingly.

Parameters
eventThe drag event to test

◆ dropEvent()

void Isis::PlotWindow::dropEvent ( QDropEvent * event)
protectedvirtual

This is called when a user drops data into our window.

The dragEnterEvent() must have said that this curve is compatible with this window. This provides all of the available options to the user (if any) set by the creator of the drag & drop event (i.e. whether or not we can move or just copy). If there are options, we create a context menu - otherwise the default action is taken.

Parameters
eventThe drop event containing the curve to put into the current window.

References add(), and plotChanged().

◆ eventFilter()

bool Isis::PlotWindow::eventFilter ( QObject * o,
QEvent * e )
protectedvirtual

This method filters the events of the objects it is connected to.

In this case, the eventFilter has been installed on the m_plot and m_legend.

Parameters
o
e
Returns
bool

Reimplemented in Isis::ScatterPlotWindow.

References closed(), mousePressEvent(), and plot().

Referenced by Isis::ScatterPlotWindow::eventFilter().

◆ fillTable

void Isis::PlotWindow::fillTable ( )
slot

Fills in the table with the data from the current curves in the plotWindow immediately.

References Isis::TableMainWindow::addToTable(), Isis::IsSpecial(), Isis::TableMainWindow::listWidget(), Isis::Null, plotCurves(), Isis::TableMainWindow::table(), Isis::toDouble(), and Isis::toString().

Referenced by add(), PlotWindow(), and showTable().

◆ mousePressEvent()

void Isis::PlotWindow::mousePressEvent ( QObject * object,
QMouseEvent * event )
protected

This is a helper method for the eventFilter() method.

When a mouse press event is seen, this handles it. For example, if the user right clicks and the clipboard contains compatible data then this will give a paste option.

Parameters
objectThe object which was pressed
eventThe mouse event which contains button information

Referenced by eventFilter().

◆ paint()

void Isis::PlotWindow::paint ( MdiCubeViewport * vp,
QPainter * painter )
virtual

Paint plot curve information onto the viewport.

Parameters
vpThe cube viewport to paint onto
painterThe painter to use for painting

Reimplemented in Isis::ScatterPlotWindow.

References plotCurves().

Referenced by Isis::ScatterPlotWindow::paint(), and Isis::AbstractPlotTool::paintViewport().

◆ plot()

◆ plotBackgroundColor()

QColor Isis::PlotWindow::plotBackgroundColor ( ) const

Returns the plot's background color.

Returns
QColor

◆ plotChanged

void Isis::PlotWindow::plotChanged ( )
signal

Emitted every time there is a change to the plot window.

Referenced by add(), configurePlotCurves(), dropEvent(), PlotWindow(), and replot().

◆ plotCurves() [1/2]

QList< CubePlotCurve * > Isis::PlotWindow::plotCurves ( )

Get a comprehensive list of the plot curves inside of this plot window, excluding plot curves that are in the process of being removed.

Returns
The plot curves contained inside of this plot window

Referenced by configurePlotCurves(), fillTable(), paint(), showTable(), and ~PlotWindow().

◆ plotCurves() [2/2]

QList< const CubePlotCurve * > Isis::PlotWindow::plotCurves ( ) const

Get a comprehensive const list of the plot curves inside of this plot window, excluding plot curves that are in the process of being removed.

Returns
The const plot curves contained inside of this plot window

◆ plotSpectrograms() [1/2]

QList< QwtPlotSpectrogram * > Isis::PlotWindow::plotSpectrograms ( )

Get a comprehensive list of the scatter plots (spectrograms) inside of this plot window.

Returns
The spectrograms (scatter plots) contained inside of this plot window

◆ plotSpectrograms() [2/2]

QList< const QwtPlotSpectrogram * > Isis::PlotWindow::plotSpectrograms ( ) const

Get a comprehensive const list of the scatter plots (spectrograms) inside of this plot window.

Returns
The const spectrograms (scatter plots) contained inside of this plot window

◆ plotTitle()

QString Isis::PlotWindow::plotTitle ( ) const

Returns the plot title.

Returns
QwtText

◆ printPlot

void Isis::PlotWindow::printPlot ( )
slot

Provides printing support of the plot image.

◆ readSettings()

void Isis::MainWindow::readSettings ( QSize defaultSize = QSize())
protectedvirtualinherited

This method ensure that the settings get written even if the Main window was only hidden, not closed.

Parameters
eventThis method is called from the constructor so that when the Main window is created, it know's it's size and location.

References Isis::MainWindow::settingsFileName().

Referenced by PlotWindow(), Isis::TableMainWindow::TableMainWindow(), and Isis::ViewportMainWindow::ViewportMainWindow().

◆ replot()

◆ requestFillTable

void Isis::PlotWindow::requestFillTable ( )
signal

Referenced by PlotWindow(), and scheduleFillTable().

◆ resetScale

void Isis::PlotWindow::resetScale ( )
slot

Sets plot scale back to the defaults.

References Isis::PlotCurve::Band.

Referenced by add(), and replot().

◆ savePlot

void Isis::PlotWindow::savePlot ( )
slot

This method allows the user to save the plot as a png, jpg, or tif image file.

◆ scheduleFillTable

void Isis::PlotWindow::scheduleFillTable ( )
slot

Fills in the table with the data from the current curves in the plotWindow once all current actions/activations are done.

This is provided for performance reasons - re-plotting 4 curves only requires one fillTable at the end, instead of after each curve change.

References requestFillTable().

Referenced by PlotWindow().

◆ setAxisLabel()

void Isis::PlotWindow::setAxisLabel ( int axisId,
QString title )

Sets the plots given axis title to the given string.

Parameters
axisId
title

◆ setDefaultRange

void Isis::PlotWindow::setDefaultRange ( )
slot

Resets the x/y min/max to the defaults.

References plot(), and setUserValues().

◆ setLabels

void Isis::PlotWindow::setLabels ( )
slot

Makes the user specified changes to the plot labels.

Referenced by changePlotLabels().

◆ setMenus()

void Isis::PlotWindow::setMenus ( QList< QMenu * > menu,
QList< QAction * > actions )
protected

Sets up the menus added from a parent object.

Parameters
menu
actions

◆ setPlotBackground()

void Isis::PlotWindow::setPlotBackground ( QColor c)

Sets the plot background color to the given color.

Parameters
c

Referenced by Isis::HistogramPlotWindow::HistogramPlotWindow(), and PlotWindow().

◆ setPlotTitle()

void Isis::PlotWindow::setPlotTitle ( QString pt)

Sets the plot title to the given string.

This does not update the window title.

Parameters
ptThe plot title to use

Referenced by PlotWindow().

◆ settingsFileName() [1/2]

◆ settingsFileName() [2/2]

QString Isis::MainWindow::settingsFileName ( QString objectTitle)
staticinherited

◆ setUserCanAddCurves()

void Isis::PlotWindow::setUserCanAddCurves ( bool userHasControl)

Allow or disallow users from manually putting curves into this plot window through either copy-and-paste or drag-and-drop.

Parameters
userHasControlTrue if users can add curves manually, false otherwise

◆ setUserValues

void Isis::PlotWindow::setUserValues ( )
slot

This method sets the scale for the axis according to the user specified numbers.

References replot().

Referenced by setDefaultRange().

◆ showHelp

void Isis::PlotWindow::showHelp ( )
slot

This method creates and shows the help dialog box for the plot window.

this is called from the Help-->Basic Help menu.

◆ showHideAllCurves

void Isis::PlotWindow::showHideAllCurves ( )
slot

This method shows or hides all of the curves in the plotWindow.

◆ showHideAllMarkers

void Isis::PlotWindow::showHideAllMarkers ( )
slot

Shows/Hides all the markers(symbols)

◆ showHideGrid

void Isis::PlotWindow::showHideGrid ( )
slot

This method hides/shows the grid on the plotWindow and changes the text for the action.

◆ showTable

void Isis::PlotWindow::showTable ( )
slot

This method is called from the showTable action on the tool bar There are some checks done to make sure there are data to fill the table.

References fillTable(), plotCurves(), Isis::TableMainWindow::setTrackListItems(), and Isis::TableMainWindow::syncColumns().

◆ showWindow()

void Isis::PlotWindow::showWindow ( )

Shows the plot window, and raises it to the front of any overlapping sibling widgets.

Referenced by Isis::AbstractPlotTool::showPlotWindow().

◆ switchBackground

void Isis::PlotWindow::switchBackground ( )
slot

This method toggles the plot background color between black and white.

◆ trackerEnabled

void Isis::PlotWindow::trackerEnabled ( )
slot

Enables the plot mouse tracker.

◆ update()

void Isis::PlotWindow::update ( MdiCubeViewport * activeViewport)
virtual

This is provided to allow children to react to tool updates.

This is useful for example for band markers in the spectral plots.

Parameters
activeViewportThe currently selected viewport

Reimplemented in Isis::SpectralPlotWindow.

◆ userCanAddCurves()

bool Isis::PlotWindow::userCanAddCurves ( ) const

Ask if a user action can add this curve to this window in general.

This verifies that the user is allowed to add curves to this window but not that a particular curve is compatible with this window.

Returns
True if the user should be allowed to paste/drop curves in general into this window

◆ xAxisUnits()

PlotCurve::Units Isis::PlotWindow::xAxisUnits ( ) const

This is the data-type of the curves' x data in this plot window.

All of the cube plot curves must have the same units for x axis data or the display will not make sense.

Returns
X-Axis Curve Data Units

Referenced by PlotWindow().

◆ yAxisUnits()

PlotCurve::Units Isis::PlotWindow::yAxisUnits ( ) const

This is the data-type of the curves' y data in this plot window.

All of the cube plot curves must have the same units for y-left axis data (y-right sometimes has different units) or the display will not make sense.

Returns
Left Y-Axis Data Units

Referenced by PlotWindow().

◆ zoomer()

QwtPlotZoomer * Isis::PlotWindow::zoomer ( )
protected

Get this window's plot's zoomer.

Returns
A QwtPlotZoomer which is associated with this PlotWindow's QwtPlot

Referenced by Isis::ScatterPlotWindow::ScatterPlotWindow().


The documentation for this class was generated from the following files: