 |
Isis 3 Programmer Reference
|
|
Isis 3 Programmer Reference
|
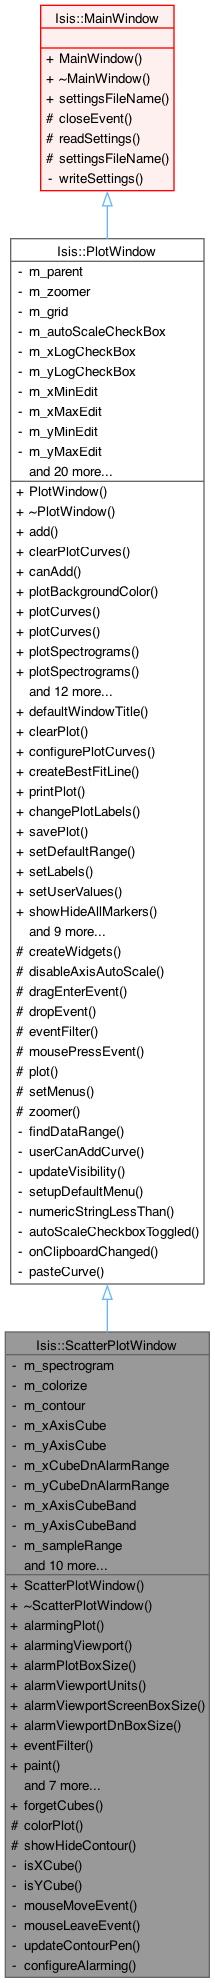
Scatter Plot Window. More...
#include <ScatterPlotWindow.h>
Public Types | |
| enum | AlarmRangeUnits { CubeUnits , ScreenUnits } |
| This enumeration differentiates alarming a strict cube DN box size from a screen region. More... | |
| enum | MenuOptions { ShowHideMarkersMenuOption = 1 , ShowHideCurvesMenuOption = 2 , ShowTableMenuOption = 4 , SaveMenuOption = 8 , PrintMenuOption = 16 , TrackMenuOption = 32 , BackgroundSwitchMenuOption = 64 , ShowHideGridMenuOption = 128 , RenameLabelsMenuOption = 256 , SetDisplayRangeMenuOption = 512 , ResetScaleMenuOption = 1024 , ClearPlotMenuOption = 2048 , DefaultHelpMenuOption = 4096 , LineFitMenuOption = 8192 , ConfigurePlotMenuOption = 16384 , AllMenuOptions } |
| There is a menu option for everything in the plot window's menu. More... | |
Public Slots | |
| void | forgetCubes () |
| This causes the window to lose it's pointers to the input cubes. | |
| void | clearPlot () |
| This method completely clears the plot of all plot items. | |
| void | configurePlotCurves () |
| This method creates a CubePlotCurveConfigureDialog object. | |
| void | createBestFitLine () |
| This method prompts the user to select the best fit line criterea. | |
| void | printPlot () |
| Provides printing support of the plot image. | |
| void | changePlotLabels () |
| This method creates the dialog box which allows the user to relabel the plot window. | |
| void | savePlot () |
| This method allows the user to save the plot as a png, jpg, or tif image file. | |
| void | setDefaultRange () |
| Resets the x/y min/max to the defaults. | |
| void | setLabels () |
| Makes the user specified changes to the plot labels. | |
| void | setUserValues () |
| This method sets the scale for the axis according to the user specified numbers. | |
| void | showHideAllMarkers () |
| Shows/Hides all the markers(symbols) | |
| void | showHideAllCurves () |
| This method shows or hides all of the curves in the plotWindow. | |
| void | resetScale () |
| Sets plot scale back to the defaults. | |
| void | showHideGrid () |
| This method hides/shows the grid on the plotWindow and changes the text for the action. | |
| void | showHelp () |
| This method creates and shows the help dialog box for the plot window. | |
| void | showTable () |
| This method is called from the showTable action on the tool bar There are some checks done to make sure there are data to fill the table. | |
| void | switchBackground () |
| This method toggles the plot background color between black and white. | |
| void | trackerEnabled () |
| Enables the plot mouse tracker. | |
| void | scheduleFillTable () |
| Fills in the table with the data from the current curves in the plotWindow once all current actions/activations are done. | |
| void | fillTable () |
| Fills in the table with the data from the current curves in the plotWindow immediately. | |
Signals | |
| void | closed () |
| Emitted when there is a close event on this window that will be accepted. | |
| void | plotChanged () |
| Emitted every time there is a change to the plot window. | |
| void | requestFillTable () |
Public Member Functions | |
| ScatterPlotWindow (QString title, Cube *xAxisCube, int xAxisBand, int xAxisBinCount, Cube *yAxisCube, int yAxisBand, int yAxisBinCount, QwtInterval sampleRange, QwtInterval lineRange, QWidget *parent) | |
| Create a scatter plot window with the given data. | |
| bool | alarmingPlot () const |
| This indicates if we are alarming from viewport to plot. | |
| bool | alarmingViewport () const |
| This indicates if we are alarming from plot to viewport. | |
| QPair< int, int > | alarmPlotBoxSize () const |
| This is the sample/line box sizes for alarming from viewport to plot. | |
| AlarmRangeUnits | alarmViewportUnits () const |
| This is the active alarming units for plot->viewport. | |
| QPair< int, int > | alarmViewportScreenBoxSize () const |
| This is the alarming box size for plot->viewport in screen units. | |
| QPair< double, double > | alarmViewportDnBoxSize () const |
| This is the alarming box size for plot->viewport in cube units (number of samples/lines). | |
| bool | eventFilter (QObject *o, QEvent *e) |
| We override events done on the plot canvas for alarming purposes. | |
| virtual void | paint (MdiCubeViewport *vp, QPainter *painter) |
| If the viewport is showing the x axis cube data or y axis cube data, and alarming is enabled, this paints alarmed values from the plot onto the viewport. | |
| void | setMousePosition (MdiCubeViewport *vp, QPoint mouseLoc) |
| Saves the current mouse position in the viewport so that the plot can be alarmed around that position. | |
| void | setAlarmingPlot (bool) |
| This enables or disables alarming viewport->plot. | |
| void | setAlarmingViewport (bool) |
| This enables or disables alarming plot->viewport. | |
| void | setAlarmPlotBoxSize (int, int) |
| This sets the box size for alarming viewport->plot in cube samples/lines. | |
| void | setAlarmViewportUnits (AlarmRangeUnits) |
| This sets the units to be used for alarming plot->viewport. | |
| void | setAlarmViewportScreenBoxSize (int, int) |
| This sets the screen pixel box size for alarming plot->viewport. | |
| void | setAlarmViewportDnBoxSize (double, double) |
| This sets the cube DN box size for alarming plot->viewport. | |
| virtual void | add (CubePlotCurve *pc) |
| This method adds the curves to the plot. | |
| virtual void | clearPlotCurves () |
| This method also clears the plot of all plot items, but does not call the table delete stuff This method is called from plotTool each time the changePlot() method is called. | |
| bool | canAdd (CubePlotCurve *curveToTest) const |
| This method tests whethere or not a CubePlotCurve can be successfully added to this window. | |
| QColor | plotBackgroundColor () const |
| Returns the plot's background color. | |
| QList< CubePlotCurve * > | plotCurves () |
| Get a comprehensive list of the plot curves inside of this plot window, excluding plot curves that are in the process of being removed. | |
| QList< const CubePlotCurve * > | plotCurves () const |
| Get a comprehensive const list of the plot curves inside of this plot window, excluding plot curves that are in the process of being removed. | |
| QList< QwtPlotSpectrogram * > | plotSpectrograms () |
| Get a comprehensive list of the scatter plots (spectrograms) inside of this plot window. | |
| QList< const QwtPlotSpectrogram * > | plotSpectrograms () const |
| Get a comprehensive const list of the scatter plots (spectrograms) inside of this plot window. | |
| QString | plotTitle () const |
| Returns the plot title. | |
| bool | userCanAddCurves () const |
| Ask if a user action can add this curve to this window in general. | |
| PlotCurve::Units | xAxisUnits () const |
| This is the data-type of the curves' x data in this plot window. | |
| PlotCurve::Units | yAxisUnits () const |
| This is the data-type of the curves' y data in this plot window. | |
| void | replot () |
| Reset the scale of the plot, replot it and emit plot changed. | |
| void | setAxisLabel (int axisId, QString title) |
| Sets the plots given axis title to the given string. | |
| void | setPlotBackground (QColor c) |
| Sets the plot background color to the given color. | |
| void | setPlotTitle (QString pt) |
| Sets the plot title to the given string. | |
| void | setUserCanAddCurves (bool) |
| Allow or disallow users from manually putting curves into this plot window through either copy-and-paste or drag-and-drop. | |
| void | showWindow () |
| Shows the plot window, and raises it to the front of any overlapping sibling widgets. | |
| virtual void | update (MdiCubeViewport *activeViewport) |
| This is provided to allow children to react to tool updates. | |
Static Public Member Functions | |
| static QString | defaultWindowTitle () |
| This is the typical suffix for plot windows, it's here in case we want to update all plot windows to have a different ending than just 'Plot' on them (for example, 'Plot Window'). | |
| static QString | settingsFileName (QString objectTitle) |
Protected Slots | |
| void | colorPlot () |
| This method switches the color mode of the scatter plot from black and white to color and visa versa. | |
| void | showHideContour () |
| This method hides or displays the contour lines on the spectrogram. | |
Protected Member Functions | |
| void | createWidgets (MenuOptions optionsToProvide) |
| This method is called by the constructor to create the plot, legend. | |
| void | disableAxisAutoScale () |
| This turns off scaling the x/y axes automatically. | |
| virtual void | dragEnterEvent (QDragEnterEvent *event) |
| When a user drags data into our plot window, we need to indicate whether or not this data is compatible with this window. | |
| virtual void | dropEvent (QDropEvent *event) |
| This is called when a user drops data into our window. | |
| void | mousePressEvent (QObject *object, QMouseEvent *e) |
| This is a helper method for the eventFilter() method. | |
| QwtPlot * | plot () |
| Get the plot encapsulated by this PlotWindow. | |
| void | setMenus (QList< QMenu * > menus, QList< QAction * > actions) |
| Sets up the menus added from a parent object. | |
| QwtPlotZoomer * | zoomer () |
| Get this window's plot's zoomer. | |
| QString | settingsFileName () const |
| virtual void | closeEvent (QCloseEvent *event) |
| This method is overridden so that we can be sure to write the current settings of the Main window. | |
| virtual void | readSettings (QSize defaultSize=QSize()) |
| This method ensure that the settings get written even if the Main window was only hidden, not closed. | |
Private Slots | |
| void | configureAlarming () |
| Give the users an alarm config dialog to change the alarming settings. | |
| void | autoScaleCheckboxToggled () |
| This is a helper method for the set scale configuration dialog. | |
| void | onClipboardChanged () |
| This slot will be called when the system clipboard is changed. | |
| void | pasteCurve () |
| When the user pastes a curve try to put it into this plot window. | |
Private Member Functions | |
| bool | isXCube (MdiCubeViewport *vp) const |
| Returns true if the viewport's cube is the cube currently being used on the x-axis. | |
| bool | isYCube (MdiCubeViewport *vp) const |
| Returns true if the viewport's cube is the cube currently being used on the y-axis. | |
| void | mouseMoveEvent (QMouseEvent *e) |
| When the mosue moves, this updates the alarming information and causes repaints on the cube viewports in order to show the alarming appropriately. | |
| void | mouseLeaveEvent (QMouseEvent *e) |
| When the mouse leaves the plot canvas we disable all alarming from plot->viewport. | |
| void | updateContourPen () |
| This sets the contour pen to an appropriate color based on the color of the plot (B/W v. | |
| QPair< double, double > | findDataRange (int axisId) const |
| This calculates the data range of the specified axis (works with xBottom and yLeft only). | |
| bool | userCanAddCurve (const QMimeData *curve) |
| Ask if a user action can add this curve to this window. | |
| void | updateVisibility (PlotCurve *curve) |
| This method sets the visibility states in the curve (and it's symbols) to match with this window's current visibility settings. | |
| void | setupDefaultMenu (MenuOptions optionsToProvide) |
| The user can add menu items from parent classes, but there are some menu items that are common between many types of plot windows. | |
| virtual void | writeSettings () const |
| This method is called when the Main window is closed or hidden to write the size and location settings to a config file in the user's home directory. | |
Static Private Member Functions | |
| static bool | numericStringLessThan (QString left, QString right) |
Private Attributes | |
| QwtPlotSpectrogram * | m_spectrogram |
| This is the scatter plot's Qwt plot item. | |
| QPointer< QAction > | m_colorize |
| The action for switching the scatter plot from B/W to color. | |
| QPointer< QAction > | m_contour |
| The action for switching on and off contour lines. | |
| Cube * | m_xAxisCube |
| The cube associated with the X-Axis DN values. | |
| Cube * | m_yAxisCube |
| The cube associated with the Y-Axis DN values. | |
| QPair< double, double > | m_xCubeDnAlarmRange |
| The DN range of the X-Axis Cube to be alarmed when painting. | |
| QPair< double, double > | m_yCubeDnAlarmRange |
| The DN range of the Y-Axis Cube to be alarmed when painting. | |
| int | m_xAxisCubeBand |
| The band on the X-Axis cube used for the scatter plot. | |
| int | m_yAxisCubeBand |
| The band on the Y-Axis cube used for the scatter plot. | |
| QwtInterval | m_sampleRange |
| The sample range (1-based inclusive) of data used for the scatter plot. | |
| QwtInterval | m_lineRange |
| The line range (1-based inclusive) of data used for the scatter plot. | |
| bool | m_alarmPlot |
| Alarm onto plot... aka alarm viewport->plot. | |
| bool | m_alarmViewport |
| Alarm onto viewport... aka alarm plot->viewport. | |
| int | m_alarmPlotSamples |
| Alarm viewport->plot viewport sample box size. | |
| int | m_alarmPlotLines |
| Alarm viewport->plot viewport line box size. | |
| AlarmRangeUnits | m_alarmViewportUnits |
| Alarm plot->viewport current units. | |
| int | m_alarmViewportScreenWidth |
| Alarm plot->viewport X (screen pixels) box size. | |
| int | m_alarmViewportScreenHeight |
| Alarm plot->viewport Y (screen pixels) box size. | |
| double | m_alarmViewportXDnBoxSize |
| Alarm plot->viewport X (Cube DN) box size. | |
| double | m_alarmViewportYDnBoxSize |
| Alarm plot->viewport Y (Cube DN) box size. | |
| QWidget * | m_parent |
| Parent widget. | |
| QwtPlotZoomer * | m_zoomer |
| Plot Zoomer. | |
| QwtPlotGrid * | m_grid |
| Plot grid lines. | |
| QCheckBox * | m_autoScaleCheckBox |
| Set Scale Dialog's checkbox for enabling automatic scaling on x & y. | |
| QCheckBox * | m_xLogCheckBox |
| Set Scale Dialog's checkbox for using logarithmic scale for the x axis. | |
| QCheckBox * | m_yLogCheckBox |
| Set Scale Dialog's checkbox for using logarithmic scale for the y axis. | |
| QLineEdit * | m_xMinEdit |
| Set Scale Dialog's edit for the min X-axis value. | |
| QLineEdit * | m_xMaxEdit |
| Set Scale Dialog's edit for the max X-axis value. | |
| QLineEdit * | m_yMinEdit |
| Set Scale Dialog's edit for the min Y-axis value. | |
| QLineEdit * | m_yMaxEdit |
| Set Scale Dialog's edit for the max Y-axis value. | |
| QLineEdit * | m_xAxisText |
| Set Labels Dialog's edit for the x-axis label. | |
| QLineEdit * | m_yAxisText |
| Set Labels Dialog's edit for the y-axis label. | |
| QLineEdit * | m_plotTitleText |
| Set Labels Dialog's edit for the plot title. | |
| QMenuBar * | m_menubar |
| Plot window's menu bar. | |
| QAction * | m_pasteAct |
| This is the paste action in the edit menu to paste a curve into the plot window. | |
| QPointer< QAction > | m_action |
| Plot window's action. | |
| QPointer< QAction > | m_showHideAllCurves |
| Hide all curves action. | |
| QPointer< QAction > | m_showHideAllMarkers |
| Hide all markers action. | |
| QPointer< QAction > | m_showHideGrid |
| Show plot grid lines action. | |
| PlotCurve::Units | m_xAxisUnits |
| The units of the data on the x-bottom axis. | |
| PlotCurve::Units | m_yAxisUnits |
| The units of the data on the y-left axis. | |
| bool | m_allowUserToAddCurves |
| Is the window showing the curve markers? | |
| bool | m_autoscaleAxes |
| True if we are autoscaling the x-bottom and y-left axes. | |
| QwtPlot * | m_plot |
| The plot in this window. | |
| QwtLegend * | m_legend |
| The legend inserted in this plot. | |
| bool | m_plotXLogScale |
| Tracks if the plot X axis is using a log (true) or linear (false) scale. | |
| bool | m_plotYLogScale |
| Tracks if the plot Y axis is using a log (true) or linear (false) scale. | |
| TableMainWindow * | m_tableWindow |
| Table window. | |
| QToolBar * | m_toolBar |
| Tool bar on the plot window. | |
| bool | m_scheduledFillTable |
Scatter Plot Window.
2014-06-23 Ian Humphrey - Modified hard coded /usgs/cpkgs/ paths to relative pathnames. Fixes #2054.
2014-07-31 Ian Humphrey - Removed ConfigurePlotMenuOption for scatter plot window. References #2089.
Definition at line 28 of file ScatterPlotWindow.h.
This enumeration differentiates alarming a strict cube DN box size from a screen region.
| Enumerator | |
|---|---|
| CubeUnits | Alarming is a DN range around the mouse. |
| ScreenUnits | Alarming is a visible area around the mouse. |
Definition at line 36 of file ScatterPlotWindow.h.
|
inherited |
There is a menu option for everything in the plot window's menu.
This is provided so that you can enable/disable any given option.
Definition at line 96 of file PlotWindow.h.
| Isis::ScatterPlotWindow::ScatterPlotWindow | ( | QString | title, |
| Cube * | xAxisCube, | ||
| int | xAxisBand, | ||
| int | xAxisBinCount, | ||
| Cube * | yAxisCube, | ||
| int | yAxisBand, | ||
| int | yAxisBinCount, | ||
| QwtInterval | sampleRange, | ||
| QwtInterval | lineRange, | ||
| QWidget * | parent ) |
Create a scatter plot window with the given data.
This will fully populate the window with scatter plot data automatically.
| title | The window title and plot title |
| xAxisCube | The cube to use for reading X values |
| xAxisBand | The band of the x axis cube to read |
| xAxisBinCount | The resolution of the x axis data |
| yAxisCube | The cube to use for reading X values |
| yAxisBand | The band of the y axis cube to read |
| yAxisBinCount | The resolution of the y axis data |
| sampleRange | The sample range, inclusive 1-based, to read data from |
| lineRange | The line range, inclusive 1-based, to read data from |
| parent | The Qt-parent relationship parent widget |
Definition at line 45 of file ScatterPlotWindow.cpp.
References colorPlot(), configureAlarming(), Isis::PlotWindow::disableAxisAutoScale(), Isis::Cube::fileName(), m_alarmPlot, m_alarmPlotLines, m_alarmPlotSamples, m_alarmViewport, m_alarmViewportScreenHeight, m_alarmViewportScreenWidth, m_alarmViewportUnits, m_alarmViewportXDnBoxSize, m_alarmViewportYDnBoxSize, m_colorize, m_contour, m_lineRange, m_sampleRange, m_spectrogram, m_xAxisCube, m_xAxisCubeBand, m_xCubeDnAlarmRange, m_yAxisCube, m_yAxisCubeBand, m_yCubeDnAlarmRange, Isis::Null, Isis::PlotWindow::plot(), Isis::PlotWindow::replot(), ScreenUnits, showHideContour(), Isis::ScatterPlotData::xCubeMax(), Isis::ScatterPlotData::xCubeMin(), Isis::ScatterPlotData::yCubeMax(), Isis::ScatterPlotData::yCubeMin(), and Isis::PlotWindow::zoomer().
|
virtual |
Definition at line 183 of file ScatterPlotWindow.cpp.
|
virtualinherited |
This method adds the curves to the plot.
| pc |
Reimplemented in Isis::HistogramPlotWindow.
Definition at line 435 of file PlotWindow.cpp.
References Isis::PlotWindow::canAdd(), Isis::PlotWindow::fillTable(), Isis::PlotWindow::m_legend, Isis::PlotWindow::m_plot, Isis::PlotWindow::plot(), Isis::PlotWindow::plotChanged(), Isis::PlotWindow::replot(), Isis::PlotWindow::resetScale(), and Isis::PlotWindow::updateVisibility().
Referenced by Isis::PlotWindow::dropEvent(), and Isis::PlotWindow::pasteCurve().
| bool Isis::ScatterPlotWindow::alarmingPlot | ( | ) | const |
This indicates if we are alarming from viewport to plot.
Definition at line 209 of file ScatterPlotWindow.cpp.
References m_alarmPlot.
Referenced by setMousePosition().
| bool Isis::ScatterPlotWindow::alarmingViewport | ( | ) | const |
This indicates if we are alarming from plot to viewport.
Definition at line 219 of file ScatterPlotWindow.cpp.
References m_alarmViewport.
Referenced by mouseMoveEvent(), and paint().
| QPair< int, int > Isis::ScatterPlotWindow::alarmPlotBoxSize | ( | ) | const |
This is the sample/line box sizes for alarming from viewport to plot.
Definition at line 229 of file ScatterPlotWindow.cpp.
References m_alarmPlotLines, and m_alarmPlotSamples.
| QPair< double, double > Isis::ScatterPlotWindow::alarmViewportDnBoxSize | ( | ) | const |
This is the alarming box size for plot->viewport in cube units (number of samples/lines).
If the current units are not cube units then this is not actively alarming the given box. These values are valid even when alarming is a screen pixel box, just not use, and they are never translated/re-calculated based on the conversion from screen pixels to cube pixels.
Definition at line 271 of file ScatterPlotWindow.cpp.
References m_alarmViewportXDnBoxSize, and m_alarmViewportYDnBoxSize.
| QPair< int, int > Isis::ScatterPlotWindow::alarmViewportScreenBoxSize | ( | ) | const |
This is the alarming box size for plot->viewport in screen units.
If the current units are not screen units, this is not actively alarming the given box. These values are valid even when alarming is a Cube DN box, just not use, and they are never translated/re-calculated based on the conversion from screen pixels to cube pixels.
Definition at line 255 of file ScatterPlotWindow.cpp.
References m_alarmViewportScreenHeight, and m_alarmViewportScreenWidth.
| ScatterPlotWindow::AlarmRangeUnits Isis::ScatterPlotWindow::alarmViewportUnits | ( | ) | const |
This is the active alarming units for plot->viewport.
We either alarm a screen pixel box size or a cube sample/line range around the mouse.
Definition at line 241 of file ScatterPlotWindow.cpp.
References m_alarmViewportUnits.
|
privateslotinherited |
This is a helper method for the set scale configuration dialog.
This enables or disables options inside of the dialog when a checkbox is clicked in the dialog. This does not change the state of the plot or plot zoomer.
Definition at line 1674 of file PlotWindow.cpp.
References Isis::PlotWindow::m_autoScaleCheckBox, Isis::PlotWindow::m_xMaxEdit, Isis::PlotWindow::m_xMinEdit, Isis::PlotWindow::m_yMaxEdit, and Isis::PlotWindow::m_yMinEdit.
Referenced by Isis::PlotWindow::setDefaultRange().
|
inherited |
This method tests whethere or not a CubePlotCurve can be successfully added to this window.
Plot curves with mismatched X/Y data from the plot's x/y axis types can not be added to the window. This does not test whether or not a user is allowed to add the curve manually, just if the curve can be added programatically.
| curveToTest | The plot curve to test for compatibility with this window |
Definition at line 304 of file PlotWindow.cpp.
References Isis::PlotWindow::m_xAxisUnits, and Isis::PlotWindow::m_yAxisUnits.
Referenced by Isis::PlotWindow::add(), and Isis::PlotWindow::userCanAddCurve().
|
slotinherited |
This method creates the dialog box which allows the user to relabel the plot window.
Definition at line 853 of file PlotWindow.cpp.
References Isis::PlotWindow::m_plot, Isis::PlotWindow::m_plotTitleText, Isis::PlotWindow::m_xAxisText, Isis::PlotWindow::m_yAxisText, Isis::PlotWindow::plot(), and Isis::PlotWindow::setLabels().
Referenced by Isis::PlotWindow::setupDefaultMenu().
|
slotinherited |
This method completely clears the plot of all plot items.
i.e. curves and markers, which also deletes the legend also calls the necessary method to delete the table stuff
Definition at line 491 of file PlotWindow.cpp.
References Isis::PlotWindow::clearPlotCurves(), Isis::PlotWindow::m_tableWindow, and Isis::TableMainWindow::table().
Referenced by Isis::PlotWindow::setupDefaultMenu().
|
virtualinherited |
This method also clears the plot of all plot items, but does not call the table delete stuff This method is called from plotTool each time the changePlot() method is called.
Definition at line 539 of file PlotWindow.cpp.
References Isis::PlotWindow::m_plot, and Isis::PlotWindow::replot().
Referenced by Isis::PlotWindow::clearPlot().
|
signalinherited |
Emitted when there is a close event on this window that will be accepted.
Referenced by Isis::PlotWindow::eventFilter().
|
protectedvirtualinherited |
This method is overridden so that we can be sure to write the current settings of the Main window.
| event |
Reimplemented in Isis::TableMainWindow, and Isis::ViewportMainWindow.
Definition at line 37 of file MainWindow.cpp.
References Isis::MainWindow::writeSettings().
Referenced by Isis::TableMainWindow::closeEvent(), and Isis::ViewportMainWindow::closeEvent().
|
protectedslot |
This method switches the color mode of the scatter plot from black and white to color and visa versa.
Definition at line 551 of file ScatterPlotWindow.cpp.
References m_colorize, m_spectrogram, Isis::PlotWindow::plot(), Isis::PlotWindow::replot(), and updateContourPen().
Referenced by ScatterPlotWindow().
|
privateslot |
Give the users an alarm config dialog to change the alarming settings.
Definition at line 711 of file ScatterPlotWindow.cpp.
Referenced by ScatterPlotWindow().
|
slotinherited |
This method creates a CubePlotCurveConfigureDialog object.
When there are no curves in this PlotWindow, the dialog will not be created.
Definition at line 507 of file PlotWindow.cpp.
References Isis::PlotWindow::plotChanged(), and Isis::PlotWindow::plotCurves().
Referenced by Isis::PlotWindow::setupDefaultMenu().
|
slotinherited |
This method prompts the user to select the best fit line criterea.
The PlotWindowBestFitDialog will create the best fit line automatically when the user asks for one, so we don't need to worry about doing any more than showing a dialog here.
Definition at line 528 of file PlotWindow.cpp.
References Isis::PlotWindow::plot().
Referenced by Isis::PlotWindow::setupDefaultMenu().
|
protectedinherited |
This method is called by the constructor to create the plot, legend.
zoomer, and main window.
| optionsToProvide | This is a bit-flag containing information on which menu options to give the user/put in the GUI. |
Definition at line 144 of file PlotWindow.cpp.
References Isis::PlotWindow::m_grid, Isis::PlotWindow::m_legend, Isis::PlotWindow::m_plot, Isis::PlotWindow::m_zoomer, and Isis::PlotWindow::setupDefaultMenu().
Referenced by Isis::PlotWindow::PlotWindow().
|
staticinherited |
This is the typical suffix for plot windows, it's here in case we want to update all plot windows to have a different ending than just 'Plot' on them (for example, 'Plot Window').
Definition at line 1809 of file PlotWindow.cpp.
Referenced by Isis::HistogramTool::createWindow(), Isis::SpatialPlotTool::createWindow(), and Isis::SpectralPlotTool::createWindow().
|
protectedinherited |
This turns off scaling the x/y axes automatically.
Use this if you have a very specific axis range you want to use, but keep in mind that users (potentially) have an option to re-enable axis auto scaling if they want to.
Definition at line 1663 of file PlotWindow.cpp.
References Isis::PlotWindow::m_autoscaleAxes.
Referenced by ScatterPlotWindow().
|
protectedvirtualinherited |
When a user drags data into our plot window, we need to indicate whether or not this data is compatible with this window.
This checks userCanAddCurve() on the drag & drop data and allows or disallowed the event accordingly.
| event | The drag event to test |
Definition at line 1822 of file PlotWindow.cpp.
References Isis::PlotWindow::m_legend, and Isis::PlotWindow::userCanAddCurve().
|
protectedvirtualinherited |
This is called when a user drops data into our window.
The dragEnterEvent() must have said that this curve is compatible with this window. This provides all of the available options to the user (if any) set by the creator of the drag & drop event (i.e. whether or not we can move or just copy). If there are options, we create a context menu - otherwise the default action is taken.
| event | The drop event containing the curve to put into the current window. |
Definition at line 1843 of file PlotWindow.cpp.
References Isis::PlotWindow::add(), Isis::PlotWindow::m_allowUserToAddCurves, and Isis::PlotWindow::plotChanged().
|
virtual |
We override events done on the plot canvas for alarming purposes.
This method will forward mouse moves and leaves to the appropriate methods.
| o | The object on which the event happened |
| e | The event that triggered this method call |
Reimplemented from Isis::PlotWindow.
Definition at line 285 of file ScatterPlotWindow.cpp.
References Isis::PlotWindow::eventFilter(), mouseLeaveEvent(), mouseMoveEvent(), and Isis::PlotWindow::plot().
|
slotinherited |
Fills in the table with the data from the current curves in the plotWindow immediately.
Definition at line 1410 of file PlotWindow.cpp.
References Isis::TableMainWindow::addToTable(), Isis::IsSpecial(), Isis::TableMainWindow::listWidget(), Isis::PlotWindow::m_plot, Isis::PlotWindow::m_tableWindow, Isis::Null, Isis::PlotWindow::plotCurves(), Isis::TableMainWindow::table(), Isis::toDouble(), and Isis::toString().
Referenced by Isis::PlotWindow::add(), Isis::PlotWindow::PlotWindow(), and Isis::PlotWindow::showTable().
|
privateinherited |
This calculates the data range of the specified axis (works with xBottom and yLeft only).
This is used to provide unit context (band #'s shouldn't ever pad) and to fix the lack of an axis when only one value exists (if there is only one x-value, this will always pad with +/- 0.5).
| axisId | This must be yLeft or xBottom |
Definition at line 1721 of file PlotWindow.cpp.
References Isis::PlotWindow::plotCurves().
Referenced by Isis::PlotWindow::resetScale().
|
slot |
This causes the window to lose it's pointers to the input cubes.
When a viewport is closed, this will prevent using the cube pointers still for alarming.
Definition at line 540 of file ScatterPlotWindow.cpp.
References m_xAxisCube, and m_yAxisCube.
|
private |
Returns true if the viewport's cube is the cube currently being used on the x-axis.
| vp | The viewport to test for a cube match |
Definition at line 607 of file ScatterPlotWindow.cpp.
References m_xAxisCube, and m_xAxisCubeBand.
Referenced by paint(), and setMousePosition().
|
private |
Returns true if the viewport's cube is the cube currently being used on the y-axis.
| vp | The viewport to test for a cube match |
Definition at line 621 of file ScatterPlotWindow.cpp.
References m_yAxisCube, and m_yAxisCubeBand.
Referenced by paint(), and setMousePosition().
|
private |
When the mouse leaves the plot canvas we disable all alarming from plot->viewport.
| e | The event that caused this method to be called |
Definition at line 683 of file ScatterPlotWindow.cpp.
References m_xCubeDnAlarmRange, m_yCubeDnAlarmRange, Isis::Null, and Isis::PlotWindow::plotChanged().
Referenced by eventFilter().
|
private |
When the mosue moves, this updates the alarming information and causes repaints on the cube viewports in order to show the alarming appropriately.
| e | The event that caused this method to be called |
Definition at line 635 of file ScatterPlotWindow.cpp.
References alarmingViewport(), m_alarmViewportScreenHeight, m_alarmViewportScreenWidth, m_alarmViewportUnits, m_alarmViewportXDnBoxSize, m_alarmViewportYDnBoxSize, m_xCubeDnAlarmRange, m_yCubeDnAlarmRange, Isis::Null, Isis::PlotWindow::plot(), Isis::PlotWindow::plotChanged(), and ScreenUnits.
Referenced by eventFilter().
|
protectedinherited |
This is a helper method for the eventFilter() method.
When a mouse press event is seen, this handles it. For example, if the user right clicks and the clipboard contains compatible data then this will give a paste option.
| object | The object which was pressed |
| event | The mouse event which contains button information |
Definition at line 1627 of file PlotWindow.cpp.
References Isis::PlotWindow::pasteCurve(), and Isis::PlotWindow::userCanAddCurve().
Referenced by Isis::PlotWindow::eventFilter().
|
staticprivateinherited |
Definition at line 1767 of file PlotWindow.cpp.
|
privateslotinherited |
This slot will be called when the system clipboard is changed.
Definition at line 1685 of file PlotWindow.cpp.
References Isis::PlotWindow::m_pasteAct, and Isis::PlotWindow::userCanAddCurve().
Referenced by Isis::PlotWindow::PlotWindow().
|
virtual |
If the viewport is showing the x axis cube data or y axis cube data, and alarming is enabled, this paints alarmed values from the plot onto the viewport.
| vp | The viewport that might need to be alarmed/painted red |
| painter | The painter to paint with |
Reimplemented from Isis::PlotWindow.
Definition at line 317 of file ScatterPlotWindow.cpp.
References alarmingViewport(), Isis::ViewportBuffer::bufferXYRect(), Isis::ViewportBuffer::getLine(), Isis::IsSpecial(), isXCube(), isYCube(), m_lineRange, m_sampleRange, m_xAxisCube, m_xAxisCubeBand, m_xCubeDnAlarmRange, m_yAxisCube, m_yAxisCubeBand, m_yCubeDnAlarmRange, Isis::Null, Isis::PlotWindow::paint(), Isis::Cube::pixelType(), Isis::Cube::read(), and Isis::ViewportBuffer::working().
|
privateslotinherited |
When the user pastes a curve try to put it into this plot window.
This shouldn't be called when the curve on the system clipboard isn't compatible.
Definition at line 1696 of file PlotWindow.cpp.
References Isis::PlotWindow::add(), Isis::PlotWindow::m_allowUserToAddCurves, and Isis::PlotWindow::plotChanged().
Referenced by Isis::PlotWindow::mousePressEvent(), and Isis::PlotWindow::setupDefaultMenu().
|
protectedinherited |
Get the plot encapsulated by this PlotWindow.
Definition at line 1652 of file PlotWindow.cpp.
References Isis::PlotWindow::m_plot.
Referenced by Isis::PlotWindow::add(), Isis::HistogramPlotWindow::add(), Isis::PlotWindow::changePlotLabels(), colorPlot(), Isis::PlotWindow::createBestFitLine(), Isis::SpectralPlotWindow::createMarker(), Isis::SpectralPlotWindow::drawBandMarkers(), Isis::PlotWindow::eventFilter(), eventFilter(), Isis::HistogramPlotWindow::HistogramPlotWindow(), mouseMoveEvent(), Isis::PlotWindow::PlotWindow(), ScatterPlotWindow(), Isis::PlotWindow::setDefaultRange(), and setMousePosition().
|
inherited |
Returns the plot's background color.
Definition at line 316 of file PlotWindow.cpp.
References Isis::PlotWindow::m_plot.
|
signalinherited |
Emitted every time there is a change to the plot window.
Referenced by Isis::PlotWindow::add(), Isis::PlotWindow::configurePlotCurves(), Isis::PlotWindow::dropEvent(), mouseLeaveEvent(), mouseMoveEvent(), Isis::PlotWindow::pasteCurve(), Isis::PlotWindow::PlotWindow(), Isis::PlotWindow::replot(), and Isis::PlotWindow::updateVisibility().
|
inherited |
Get a comprehensive list of the plot curves inside of this plot window, excluding plot curves that are in the process of being removed.
Definition at line 327 of file PlotWindow.cpp.
References Isis::PlotWindow::m_plot.
Referenced by Isis::PlotWindow::configurePlotCurves(), Isis::PlotWindow::fillTable(), Isis::PlotWindow::findDataRange(), Isis::PlotWindow::paint(), and Isis::PlotWindow::showTable().
|
inherited |
Get a comprehensive const list of the plot curves inside of this plot window, excluding plot curves that are in the process of being removed.
Definition at line 353 of file PlotWindow.cpp.
References Isis::PlotWindow::m_plot.
|
inherited |
Get a comprehensive list of the scatter plots (spectrograms) inside of this plot window.
Definition at line 380 of file PlotWindow.cpp.
References Isis::PlotWindow::m_plot.
|
inherited |
Get a comprehensive const list of the scatter plots (spectrograms) inside of this plot window.
Definition at line 408 of file PlotWindow.cpp.
References Isis::PlotWindow::m_plot.
|
inherited |
Returns the plot title.
Definition at line 240 of file PlotWindow.cpp.
References Isis::PlotWindow::m_plot.
|
slotinherited |
Provides printing support of the plot image.
Definition at line 572 of file PlotWindow.cpp.
References Isis::PlotWindow::m_plot.
Referenced by Isis::PlotWindow::setupDefaultMenu().
|
protectedvirtualinherited |
This method ensure that the settings get written even if the Main window was only hidden, not closed.
| event | This method is called from the constructor so that when the Main window is created, it know's it's size and location. |
Reimplemented in Isis::MosaicMainWindow.
Definition at line 80 of file MainWindow.cpp.
Referenced by Isis::PlotWindow::PlotWindow(), Isis::TableMainWindow::TableMainWindow(), and Isis::ViewportMainWindow::ViewportMainWindow().
|
inherited |
Reset the scale of the plot, replot it and emit plot changed.
Definition at line 1796 of file PlotWindow.cpp.
References Isis::PlotWindow::plotChanged(), and Isis::PlotWindow::resetScale().
Referenced by Isis::PlotWindow::add(), Isis::PlotWindow::clearPlotCurves(), colorPlot(), ScatterPlotWindow(), Isis::SpectralPlotWindow::setBandMarkersVisible(), Isis::PlotWindow::setUserValues(), and showHideContour().
|
slotinherited |
Sets plot scale back to the defaults.
Definition at line 659 of file PlotWindow.cpp.
References Isis::PlotCurve::Band, Isis::PlotWindow::findDataRange(), Isis::PlotWindow::m_autoscaleAxes, Isis::PlotWindow::m_plot, Isis::PlotWindow::m_xAxisUnits, Isis::PlotWindow::m_yAxisUnits, and Isis::PlotWindow::m_zoomer.
Referenced by Isis::PlotWindow::add(), Isis::PlotWindow::replot(), and Isis::PlotWindow::setupDefaultMenu().
|
slotinherited |
This method allows the user to save the plot as a png, jpg, or tif image file.
Definition at line 604 of file PlotWindow.cpp.
References Isis::PlotWindow::m_plot.
Referenced by Isis::PlotWindow::setupDefaultMenu().
|
slotinherited |
Fills in the table with the data from the current curves in the plotWindow once all current actions/activations are done.
This is provided for performance reasons - re-plotting 4 curves only requires one fillTable at the end, instead of after each curve change.
Definition at line 1398 of file PlotWindow.cpp.
Referenced by Isis::PlotWindow::PlotWindow().
| void Isis::ScatterPlotWindow::setAlarmingPlot | ( | bool | alarming | ) |
This enables or disables alarming viewport->plot.
| alarming | True to enable alarming viewport->plot, false to disable alarming viewport->plot |
Definition at line 460 of file ScatterPlotWindow.cpp.
References m_alarmPlot.
| void Isis::ScatterPlotWindow::setAlarmingViewport | ( | bool | alarming | ) |
This enables or disables alarming plot->viewport.
| alarming | True to enable alarming plot->viewport, false to disable alarming plot->viewport |
Definition at line 471 of file ScatterPlotWindow.cpp.
References m_alarmViewport.
| void Isis::ScatterPlotWindow::setAlarmPlotBoxSize | ( | int | samples, |
| int | lines ) |
This sets the box size for alarming viewport->plot in cube samples/lines.
| samples | How many samples (total) the alarming box size should be. This should be odd because the mouse is in the center. |
| lines | How many lines (total) the alarming box size should be. This should be odd because the mouse is in the center. |
Definition at line 484 of file ScatterPlotWindow.cpp.
References m_alarmPlotLines, and m_alarmPlotSamples.
| void Isis::ScatterPlotWindow::setAlarmViewportDnBoxSize | ( | double | xDnBoxSize, |
| double | yDnBoxSize ) |
This sets the cube DN box size for alarming plot->viewport.
If the current alarming units for plot->viewport isn't cube pixels, these values will still be stored off and just not be active until the units are changed.
| xDnBoxSize | The Cube DN box size (total) around the mouse in the X direction to be used for alarming. |
| yDnBoxSize | The Cube DN box size (total) around the mouse in the Y direction to be used for alarming. |
Definition at line 528 of file ScatterPlotWindow.cpp.
References m_alarmViewportXDnBoxSize, and m_alarmViewportYDnBoxSize.
| void Isis::ScatterPlotWindow::setAlarmViewportScreenBoxSize | ( | int | width, |
| int | height ) |
This sets the screen pixel box size for alarming plot->viewport.
If the current alarming units for plot->viewport isn't screen pixels, these values will still be stored off and just not be active until the units are changed.
| width | The screen pixels (total) around the mouse in the X direction to be used for alarming. |
| height | The screen pixels (total) around the mouse in the Y direction to be used for alarming. |
Definition at line 511 of file ScatterPlotWindow.cpp.
References m_alarmViewportScreenHeight, and m_alarmViewportScreenWidth.
| void Isis::ScatterPlotWindow::setAlarmViewportUnits | ( | AlarmRangeUnits | units | ) |
This sets the units to be used for alarming plot->viewport.
| units | The units (screen or cube DN range) to use for alarming. |
Definition at line 495 of file ScatterPlotWindow.cpp.
References m_alarmViewportUnits.
|
inherited |
Sets the plots given axis title to the given string.
| axisId | |
| title |
Definition at line 207 of file PlotWindow.cpp.
References Isis::PlotWindow::m_plot.
|
slotinherited |
Resets the x/y min/max to the defaults.
Definition at line 742 of file PlotWindow.cpp.
References Isis::PlotWindow::autoScaleCheckboxToggled(), Isis::PlotWindow::m_autoscaleAxes, Isis::PlotWindow::m_autoScaleCheckBox, Isis::PlotWindow::m_plotXLogScale, Isis::PlotWindow::m_plotYLogScale, Isis::PlotWindow::m_xLogCheckBox, Isis::PlotWindow::m_xMaxEdit, Isis::PlotWindow::m_xMinEdit, Isis::PlotWindow::m_yLogCheckBox, Isis::PlotWindow::m_yMaxEdit, Isis::PlotWindow::m_yMinEdit, Isis::PlotWindow::plot(), and Isis::PlotWindow::setUserValues().
Referenced by Isis::PlotWindow::setupDefaultMenu().
|
slotinherited |
Makes the user specified changes to the plot labels.
Definition at line 909 of file PlotWindow.cpp.
References Isis::PlotWindow::m_plot, Isis::PlotWindow::m_plotTitleText, Isis::PlotWindow::m_xAxisText, and Isis::PlotWindow::m_yAxisText.
Referenced by Isis::PlotWindow::changePlotLabels().
|
protectedinherited |
Sets up the menus added from a parent object.
| menu | |
| actions |
Definition at line 1357 of file PlotWindow.cpp.
References Isis::PlotWindow::m_menubar, and Isis::PlotWindow::m_toolBar.
Referenced by Isis::PlotWindow::setupDefaultMenu().
| void Isis::ScatterPlotWindow::setMousePosition | ( | MdiCubeViewport * | vp, |
| QPoint | mouseLoc ) |
Saves the current mouse position in the viewport so that the plot can be alarmed around that position.
| vp | The viewport that received the mouse event |
| mouseLoc | The location on the viewport wheere the mouse is, in screen coordinates. |
Definition at line 406 of file ScatterPlotWindow.cpp.
References alarmingPlot(), Isis::ScatterPlotData::clearAlarms(), Isis::IsSpecial(), isXCube(), isYCube(), m_alarmPlotLines, m_alarmPlotSamples, m_lineRange, m_sampleRange, m_spectrogram, m_xAxisCube, m_xAxisCubeBand, m_yAxisCube, m_yAxisCubeBand, Isis::Null, Isis::Cube::pixelType(), Isis::PlotWindow::plot(), and Isis::Cube::read().
|
inherited |
Sets the plot background color to the given color.
| c |
Definition at line 288 of file PlotWindow.cpp.
References Isis::PlotWindow::m_plot.
Referenced by Isis::HistogramPlotWindow::HistogramPlotWindow(), and Isis::PlotWindow::PlotWindow().
|
inherited |
Sets the plot title to the given string.
This does not update the window title.
| pt | The plot title to use |
Definition at line 218 of file PlotWindow.cpp.
References Isis::PlotWindow::m_plot.
Referenced by Isis::PlotWindow::PlotWindow().
|
protectedinherited |
Definition at line 96 of file MainWindow.cpp.
|
staticinherited |
Definition at line 43 of file MainWindow.cpp.
|
privateinherited |
The user can add menu items from parent classes, but there are some menu items that are common between many types of plot windows.
| optionsToProvide | A bit-flag containing information on which options to provide to the users. |
Definition at line 1047 of file PlotWindow.cpp.
References Isis::PlotWindow::BackgroundSwitchMenuOption, Isis::PlotWindow::changePlotLabels(), Isis::PlotWindow::clearPlot(), Isis::PlotWindow::ClearPlotMenuOption, Isis::PlotWindow::configurePlotCurves(), Isis::PlotWindow::ConfigurePlotMenuOption, Isis::PlotWindow::createBestFitLine(), Isis::PlotWindow::LineFitMenuOption, Isis::PlotWindow::m_pasteAct, Isis::PlotWindow::m_plot, Isis::PlotWindow::m_showHideAllCurves, Isis::PlotWindow::m_showHideAllMarkers, Isis::PlotWindow::m_showHideGrid, Isis::PlotWindow::pasteCurve(), Isis::PlotWindow::PrintMenuOption, Isis::PlotWindow::printPlot(), Isis::PlotWindow::RenameLabelsMenuOption, Isis::PlotWindow::resetScale(), Isis::PlotWindow::ResetScaleMenuOption, Isis::PlotWindow::SaveMenuOption, Isis::PlotWindow::savePlot(), Isis::PlotWindow::setDefaultRange(), Isis::PlotWindow::SetDisplayRangeMenuOption, Isis::PlotWindow::setMenus(), Isis::PlotWindow::showHelp(), Isis::PlotWindow::showHideAllCurves(), Isis::PlotWindow::showHideAllMarkers(), Isis::PlotWindow::ShowHideCurvesMenuOption, Isis::PlotWindow::showHideGrid(), Isis::PlotWindow::ShowHideGridMenuOption, Isis::PlotWindow::ShowHideMarkersMenuOption, Isis::PlotWindow::showTable(), Isis::PlotWindow::ShowTableMenuOption, Isis::PlotWindow::switchBackground(), Isis::PlotWindow::trackerEnabled(), and Isis::PlotWindow::TrackMenuOption.
Referenced by Isis::PlotWindow::createWidgets().
|
inherited |
Allow or disallow users from manually putting curves into this plot window through either copy-and-paste or drag-and-drop.
| userHasControl | True if users can add curves manually, false otherwise |
Definition at line 230 of file PlotWindow.cpp.
References Isis::PlotWindow::m_allowUserToAddCurves.
|
slotinherited |
This method sets the scale for the axis according to the user specified numbers.
Definition at line 693 of file PlotWindow.cpp.
References Isis::PlotWindow::m_autoscaleAxes, Isis::PlotWindow::m_autoScaleCheckBox, Isis::PlotWindow::m_plot, Isis::PlotWindow::m_plotXLogScale, Isis::PlotWindow::m_plotYLogScale, Isis::PlotWindow::m_xLogCheckBox, Isis::PlotWindow::m_xMaxEdit, Isis::PlotWindow::m_xMinEdit, Isis::PlotWindow::m_yLogCheckBox, Isis::PlotWindow::m_yMaxEdit, Isis::PlotWindow::m_yMinEdit, Isis::PlotWindow::m_zoomer, and Isis::PlotWindow::replot().
Referenced by Isis::PlotWindow::setDefaultRange().
|
slotinherited |
This method creates and shows the help dialog box for the plot window.
this is called from the Help-->Basic Help menu.
Definition at line 998 of file PlotWindow.cpp.
References Isis::PlotWindow::m_plot.
Referenced by Isis::PlotWindow::setupDefaultMenu().
|
slotinherited |
This method shows or hides all of the curves in the plotWindow.
Definition at line 966 of file PlotWindow.cpp.
References Isis::PlotWindow::m_plot, and Isis::PlotWindow::m_showHideAllCurves.
Referenced by Isis::PlotWindow::setupDefaultMenu().
|
slotinherited |
Shows/Hides all the markers(symbols)
Definition at line 938 of file PlotWindow.cpp.
References Isis::PlotWindow::m_plot, and Isis::PlotWindow::m_showHideAllMarkers.
Referenced by Isis::PlotWindow::setupDefaultMenu().
|
protectedslot |
This method hides or displays the contour lines on the spectrogram.
Definition at line 585 of file ScatterPlotWindow.cpp.
References m_contour, m_spectrogram, Isis::PlotWindow::replot(), and updateContourPen().
Referenced by ScatterPlotWindow().
|
slotinherited |
This method hides/shows the grid on the plotWindow and changes the text for the action.
Definition at line 922 of file PlotWindow.cpp.
References Isis::PlotWindow::m_grid, Isis::PlotWindow::m_plot, and Isis::PlotWindow::m_showHideGrid.
Referenced by Isis::PlotWindow::setupDefaultMenu().
|
slotinherited |
This method is called from the showTable action on the tool bar There are some checks done to make sure there are data to fill the table.
Definition at line 1565 of file PlotWindow.cpp.
References Isis::PlotWindow::fillTable(), Isis::PlotWindow::m_parent, Isis::PlotWindow::m_tableWindow, Isis::PlotWindow::plotCurves(), Isis::TableMainWindow::setTrackListItems(), and Isis::TableMainWindow::syncColumns().
Referenced by Isis::PlotWindow::setupDefaultMenu().
|
inherited |
Shows the plot window, and raises it to the front of any overlapping sibling widgets.
Definition at line 184 of file PlotWindow.cpp.
Referenced by Isis::AbstractPlotTool::selectedWindowChanged(), and Isis::AbstractPlotTool::showPlotWindow().
|
slotinherited |
This method toggles the plot background color between black and white.
Definition at line 634 of file PlotWindow.cpp.
References Isis::PlotWindow::m_grid, Isis::PlotWindow::m_plot, and Isis::PlotWindow::m_zoomer.
Referenced by Isis::PlotWindow::setupDefaultMenu().
|
slotinherited |
Enables the plot mouse tracker.
Definition at line 559 of file PlotWindow.cpp.
References Isis::PlotWindow::m_zoomer.
Referenced by Isis::PlotWindow::setupDefaultMenu().
|
virtualinherited |
This is provided to allow children to react to tool updates.
This is useful for example for band markers in the spectral plots.
| activeViewport | The currently selected viewport |
Reimplemented in Isis::SpectralPlotWindow.
Definition at line 196 of file PlotWindow.cpp.
|
private |
This sets the contour pen to an appropriate color based on the color of the plot (B/W v.
Color). The contour pen is set to red for color, white for B/W.
Definition at line 698 of file ScatterPlotWindow.cpp.
References m_colorize, and m_spectrogram.
Referenced by colorPlot(), and showHideContour().
|
privateinherited |
This method sets the visibility states in the curve (and it's symbols) to match with this window's current visibility settings.
Every means of adding a curve to the window needs to call this with the curve that is being added, otherwise visibility states will not be consistent.
| curve | Curve (with symbols) to set the visibility states on |
Definition at line 1329 of file PlotWindow.cpp.
References Isis::PlotWindow::m_showHideAllCurves, Isis::PlotWindow::m_showHideAllMarkers, and Isis::PlotWindow::plotChanged().
Referenced by Isis::PlotWindow::add().
|
privateinherited |
Ask if a user action can add this curve to this window.
This verifies that the user is allowed to add curves to this window and that programmatically the curve can be added (i.e. things such as the X/Y data units match).
| curve | Mime-data containing a plot curve to be added |
Definition at line 1305 of file PlotWindow.cpp.
References Isis::PlotWindow::canAdd(), and Isis::PlotWindow::m_allowUserToAddCurves.
Referenced by Isis::PlotWindow::dragEnterEvent(), Isis::PlotWindow::mousePressEvent(), and Isis::PlotWindow::onClipboardChanged().
|
inherited |
Ask if a user action can add this curve to this window in general.
This verifies that the user is allowed to add curves to this window but not that a particular curve is compatible with this window.
Definition at line 253 of file PlotWindow.cpp.
References Isis::PlotWindow::m_allowUserToAddCurves.
|
privatevirtualinherited |
This method is called when the Main window is closed or hidden to write the size and location settings to a config file in the user's home directory.
Definition at line 124 of file MainWindow.cpp.
Referenced by Isis::MainWindow::closeEvent().
|
inherited |
This is the data-type of the curves' x data in this plot window.
All of the cube plot curves must have the same units for x axis data or the display will not make sense.
Definition at line 265 of file PlotWindow.cpp.
References Isis::PlotWindow::m_xAxisUnits.
Referenced by Isis::SpectralPlotWindow::drawBandMarkers(), and Isis::PlotWindow::PlotWindow().
|
inherited |
This is the data-type of the curves' y data in this plot window.
All of the cube plot curves must have the same units for y-left axis data (y-right sometimes has different units) or the display will not make sense.
Definition at line 277 of file PlotWindow.cpp.
References Isis::PlotWindow::m_yAxisUnits.
Referenced by Isis::PlotWindow::PlotWindow().
|
protectedinherited |
Get this window's plot's zoomer.
Definition at line 1387 of file PlotWindow.cpp.
References Isis::PlotWindow::m_zoomer.
Referenced by ScatterPlotWindow().
|
privateinherited |
Plot window's action.
Definition at line 312 of file PlotWindow.h.
|
private |
Alarm onto plot... aka alarm viewport->plot.
Definition at line 115 of file ScatterPlotWindow.h.
Referenced by alarmingPlot(), ScatterPlotWindow(), and setAlarmingPlot().
|
private |
Alarm viewport->plot viewport line box size.
Definition at line 122 of file ScatterPlotWindow.h.
Referenced by alarmPlotBoxSize(), ScatterPlotWindow(), setAlarmPlotBoxSize(), and setMousePosition().
|
private |
Alarm viewport->plot viewport sample box size.
Definition at line 120 of file ScatterPlotWindow.h.
Referenced by alarmPlotBoxSize(), ScatterPlotWindow(), setAlarmPlotBoxSize(), and setMousePosition().
|
private |
Alarm onto viewport... aka alarm plot->viewport.
Definition at line 117 of file ScatterPlotWindow.h.
Referenced by alarmingViewport(), ScatterPlotWindow(), and setAlarmingViewport().
|
private |
Alarm plot->viewport Y (screen pixels) box size.
Definition at line 129 of file ScatterPlotWindow.h.
Referenced by alarmViewportScreenBoxSize(), mouseMoveEvent(), ScatterPlotWindow(), and setAlarmViewportScreenBoxSize().
|
private |
Alarm plot->viewport X (screen pixels) box size.
Definition at line 127 of file ScatterPlotWindow.h.
Referenced by alarmViewportScreenBoxSize(), mouseMoveEvent(), ScatterPlotWindow(), and setAlarmViewportScreenBoxSize().
|
private |
Alarm plot->viewport current units.
Definition at line 125 of file ScatterPlotWindow.h.
Referenced by alarmViewportUnits(), mouseMoveEvent(), ScatterPlotWindow(), and setAlarmViewportUnits().
|
private |
Alarm plot->viewport X (Cube DN) box size.
Definition at line 131 of file ScatterPlotWindow.h.
Referenced by alarmViewportDnBoxSize(), mouseMoveEvent(), ScatterPlotWindow(), and setAlarmViewportDnBoxSize().
|
private |
Alarm plot->viewport Y (Cube DN) box size.
Definition at line 133 of file ScatterPlotWindow.h.
Referenced by alarmViewportDnBoxSize(), mouseMoveEvent(), ScatterPlotWindow(), and setAlarmViewportDnBoxSize().
|
privateinherited |
Is the window showing the curve markers?
Definition at line 326 of file PlotWindow.h.
Referenced by Isis::PlotWindow::dropEvent(), Isis::PlotWindow::pasteCurve(), Isis::PlotWindow::PlotWindow(), Isis::PlotWindow::setUserCanAddCurves(), Isis::PlotWindow::userCanAddCurve(), and Isis::PlotWindow::userCanAddCurves().
|
privateinherited |
True if we are autoscaling the x-bottom and y-left axes.
Definition at line 328 of file PlotWindow.h.
Referenced by Isis::PlotWindow::disableAxisAutoScale(), Isis::PlotWindow::PlotWindow(), Isis::PlotWindow::resetScale(), Isis::PlotWindow::setDefaultRange(), and Isis::PlotWindow::setUserValues().
|
privateinherited |
Set Scale Dialog's checkbox for enabling automatic scaling on x & y.
Definition at line 281 of file PlotWindow.h.
Referenced by Isis::PlotWindow::autoScaleCheckboxToggled(), Isis::PlotWindow::setDefaultRange(), and Isis::PlotWindow::setUserValues().
|
private |
The action for switching the scatter plot from B/W to color.
Definition at line 93 of file ScatterPlotWindow.h.
Referenced by colorPlot(), ScatterPlotWindow(), and updateContourPen().
|
private |
The action for switching on and off contour lines.
Definition at line 95 of file ScatterPlotWindow.h.
Referenced by ScatterPlotWindow(), and showHideContour().
|
privateinherited |
Plot grid lines.
Definition at line 279 of file PlotWindow.h.
Referenced by Isis::PlotWindow::createWidgets(), Isis::PlotWindow::showHideGrid(), and Isis::PlotWindow::switchBackground().
|
privateinherited |
The legend inserted in this plot.
Definition at line 331 of file PlotWindow.h.
Referenced by Isis::PlotWindow::add(), Isis::PlotWindow::createWidgets(), and Isis::PlotWindow::dragEnterEvent().
|
private |
The line range (1-based inclusive) of data used for the scatter plot.
Definition at line 112 of file ScatterPlotWindow.h.
Referenced by paint(), ScatterPlotWindow(), and setMousePosition().
|
privateinherited |
Plot window's menu bar.
Definition at line 302 of file PlotWindow.h.
Referenced by Isis::PlotWindow::PlotWindow(), and Isis::PlotWindow::setMenus().
|
privateinherited |
Parent widget.
Definition at line 275 of file PlotWindow.h.
Referenced by Isis::PlotWindow::PlotWindow(), and Isis::PlotWindow::showTable().
|
privateinherited |
This is the paste action in the edit menu to paste a curve into the plot window.
This is enabled or disabled based on what is in the clipboard.
Definition at line 309 of file PlotWindow.h.
Referenced by Isis::PlotWindow::onClipboardChanged(), Isis::PlotWindow::PlotWindow(), and Isis::PlotWindow::setupDefaultMenu().
|
privateinherited |
The plot in this window.
Definition at line 330 of file PlotWindow.h.
Referenced by Isis::PlotWindow::add(), Isis::PlotWindow::changePlotLabels(), Isis::PlotWindow::clearPlotCurves(), Isis::PlotWindow::createWidgets(), Isis::PlotWindow::fillTable(), Isis::PlotWindow::plot(), Isis::PlotWindow::plotBackgroundColor(), Isis::PlotWindow::plotCurves(), Isis::PlotWindow::plotCurves(), Isis::PlotWindow::plotSpectrograms(), Isis::PlotWindow::plotSpectrograms(), Isis::PlotWindow::plotTitle(), Isis::PlotWindow::printPlot(), Isis::PlotWindow::resetScale(), Isis::PlotWindow::savePlot(), Isis::PlotWindow::setAxisLabel(), Isis::PlotWindow::setLabels(), Isis::PlotWindow::setPlotBackground(), Isis::PlotWindow::setPlotTitle(), Isis::PlotWindow::setupDefaultMenu(), Isis::PlotWindow::setUserValues(), Isis::PlotWindow::showHelp(), Isis::PlotWindow::showHideAllCurves(), Isis::PlotWindow::showHideAllMarkers(), Isis::PlotWindow::showHideGrid(), and Isis::PlotWindow::switchBackground().
|
privateinherited |
Set Labels Dialog's edit for the plot title.
Definition at line 299 of file PlotWindow.h.
Referenced by Isis::PlotWindow::changePlotLabels(), and Isis::PlotWindow::setLabels().
|
privateinherited |
Tracks if the plot X axis is using a log (true) or linear (false) scale.
Definition at line 332 of file PlotWindow.h.
Referenced by Isis::PlotWindow::setDefaultRange(), and Isis::PlotWindow::setUserValues().
|
privateinherited |
Tracks if the plot Y axis is using a log (true) or linear (false) scale.
Definition at line 333 of file PlotWindow.h.
Referenced by Isis::PlotWindow::setDefaultRange(), and Isis::PlotWindow::setUserValues().
|
private |
The sample range (1-based inclusive) of data used for the scatter plot.
Definition at line 110 of file ScatterPlotWindow.h.
Referenced by paint(), ScatterPlotWindow(), and setMousePosition().
|
privateinherited |
Definition at line 337 of file PlotWindow.h.
|
privateinherited |
Hide all curves action.
Definition at line 314 of file PlotWindow.h.
Referenced by Isis::PlotWindow::setupDefaultMenu(), Isis::PlotWindow::showHideAllCurves(), and Isis::PlotWindow::updateVisibility().
|
privateinherited |
Hide all markers action.
Definition at line 316 of file PlotWindow.h.
Referenced by Isis::PlotWindow::setupDefaultMenu(), Isis::PlotWindow::showHideAllMarkers(), and Isis::PlotWindow::updateVisibility().
|
privateinherited |
Show plot grid lines action.
Definition at line 318 of file PlotWindow.h.
Referenced by Isis::PlotWindow::setupDefaultMenu(), and Isis::PlotWindow::showHideGrid().
|
private |
This is the scatter plot's Qwt plot item.
Definition at line 90 of file ScatterPlotWindow.h.
Referenced by colorPlot(), ScatterPlotWindow(), setMousePosition(), showHideContour(), and updateContourPen().
|
privateinherited |
Table window.
Definition at line 334 of file PlotWindow.h.
Referenced by Isis::PlotWindow::clearPlot(), Isis::PlotWindow::fillTable(), Isis::PlotWindow::PlotWindow(), and Isis::PlotWindow::showTable().
|
privateinherited |
Tool bar on the plot window.
Definition at line 335 of file PlotWindow.h.
Referenced by Isis::PlotWindow::PlotWindow(), and Isis::PlotWindow::setMenus().
|
private |
The cube associated with the X-Axis DN values.
Definition at line 98 of file ScatterPlotWindow.h.
Referenced by forgetCubes(), isXCube(), paint(), ScatterPlotWindow(), and setMousePosition().
|
private |
The band on the X-Axis cube used for the scatter plot.
Definition at line 106 of file ScatterPlotWindow.h.
Referenced by isXCube(), paint(), ScatterPlotWindow(), and setMousePosition().
|
privateinherited |
Set Labels Dialog's edit for the x-axis label.
Definition at line 295 of file PlotWindow.h.
Referenced by Isis::PlotWindow::changePlotLabels(), and Isis::PlotWindow::setLabels().
|
privateinherited |
The units of the data on the x-bottom axis.
Definition at line 321 of file PlotWindow.h.
Referenced by Isis::PlotWindow::canAdd(), Isis::PlotWindow::PlotWindow(), Isis::PlotWindow::resetScale(), and Isis::PlotWindow::xAxisUnits().
|
private |
The DN range of the X-Axis Cube to be alarmed when painting.
Definition at line 102 of file ScatterPlotWindow.h.
Referenced by mouseLeaveEvent(), mouseMoveEvent(), paint(), and ScatterPlotWindow().
|
privateinherited |
Set Scale Dialog's checkbox for using logarithmic scale for the x axis.
Definition at line 283 of file PlotWindow.h.
Referenced by Isis::PlotWindow::setDefaultRange(), and Isis::PlotWindow::setUserValues().
|
privateinherited |
Set Scale Dialog's edit for the max X-axis value.
Definition at line 289 of file PlotWindow.h.
Referenced by Isis::PlotWindow::autoScaleCheckboxToggled(), Isis::PlotWindow::setDefaultRange(), and Isis::PlotWindow::setUserValues().
|
privateinherited |
Set Scale Dialog's edit for the min X-axis value.
Definition at line 287 of file PlotWindow.h.
Referenced by Isis::PlotWindow::autoScaleCheckboxToggled(), Isis::PlotWindow::setDefaultRange(), and Isis::PlotWindow::setUserValues().
|
private |
The cube associated with the Y-Axis DN values.
Definition at line 100 of file ScatterPlotWindow.h.
Referenced by forgetCubes(), isYCube(), paint(), ScatterPlotWindow(), and setMousePosition().
|
private |
The band on the Y-Axis cube used for the scatter plot.
Definition at line 108 of file ScatterPlotWindow.h.
Referenced by isYCube(), paint(), ScatterPlotWindow(), and setMousePosition().
|
privateinherited |
Set Labels Dialog's edit for the y-axis label.
Definition at line 297 of file PlotWindow.h.
Referenced by Isis::PlotWindow::changePlotLabels(), and Isis::PlotWindow::setLabels().
|
privateinherited |
The units of the data on the y-left axis.
Definition at line 323 of file PlotWindow.h.
Referenced by Isis::PlotWindow::canAdd(), Isis::PlotWindow::PlotWindow(), Isis::PlotWindow::resetScale(), and Isis::PlotWindow::yAxisUnits().
|
private |
The DN range of the Y-Axis Cube to be alarmed when painting.
Definition at line 104 of file ScatterPlotWindow.h.
Referenced by mouseLeaveEvent(), mouseMoveEvent(), paint(), and ScatterPlotWindow().
|
privateinherited |
Set Scale Dialog's checkbox for using logarithmic scale for the y axis.
Definition at line 285 of file PlotWindow.h.
Referenced by Isis::PlotWindow::setDefaultRange(), and Isis::PlotWindow::setUserValues().
|
privateinherited |
Set Scale Dialog's edit for the max Y-axis value.
Definition at line 293 of file PlotWindow.h.
Referenced by Isis::PlotWindow::autoScaleCheckboxToggled(), Isis::PlotWindow::setDefaultRange(), and Isis::PlotWindow::setUserValues().
|
privateinherited |
Set Scale Dialog's edit for the min Y-axis value.
Definition at line 291 of file PlotWindow.h.
Referenced by Isis::PlotWindow::autoScaleCheckboxToggled(), Isis::PlotWindow::setDefaultRange(), and Isis::PlotWindow::setUserValues().
|
privateinherited |
Plot Zoomer.
Definition at line 277 of file PlotWindow.h.
Referenced by Isis::PlotWindow::createWidgets(), Isis::PlotWindow::resetScale(), Isis::PlotWindow::setUserValues(), Isis::PlotWindow::switchBackground(), Isis::PlotWindow::trackerEnabled(), and Isis::PlotWindow::zoomer().