ISIS Application Documentation
grid | Printer Friendly View | TOC | Home |
Add a graticule or rectangular grid to the input image
| Overview | Parameters | Example 1 | Example 2 | Example 3 |
Description
This program superimposes a user-defined grid on an input image.
Two types of grids are available: 1. A graticule based on latitude and longitude coordinates where (MODE=GROUND).Defaults:
The grid pattern will intersect a specific origin of either (latitude,longitude) or (sample,line) position. Grid lines are drawn at intervals from the origin based on the increment values defined by the user. The graticule produced may not match the image coordinates exactly, so the result will have outer grid cells that might have different heights and widths than the interior grid cells. In addition, if the LATINC and LONINC are too large compared with your image map scale, the grid lines may miss your image. If the increments are too small, the grid lines may be overly dense. This application will draw grids on either ISIS level0, level1 (with successful spiceinit), and level2 cubes, or mosaics. The mapping information in the labels will be used to draw grid lines on mosaics and Level2 images. If the latitude and longitude information cannot be calculated or extracted using the image label contents, then use the IMAGE mode. For Cubes with an associated band-dependent camera model (latitude, longitude coordinates do not correspond to the same sample, line coordinates in each band,) the grid is recalculated for each band. Example Parameter Settings for Grids: Example 1: Superimpose a basic latitude/longitude graticule with grid lines drawn every 10 degrees based on zero: MODE=GROUND BASELAT=0 BASELON=0 LATINC=10 LONINC=10 Example 2: Superimpose a graticule on an input image that intersects at line 23 and sample 17, with vertical lines drawn every 30 pixels and horizontal lines every 40 pixels: MODE=IMAGE BASELINE=23 BASESAMPLE=17 SINC=30 LINC=40 Note: MODE=GROUND cannot be used when sample and line coordinates are used. Example 3: Superimpose a latitude/longitude graticule with a grid intersection at -5.0 degree latitude and 140.0 degree longitude, with latitude lines drawn every 2.5 degrees and longitude lines drawn every 3 degrees: MODE=GROUND BASELAT=-5.0 BASELON=140 LATINC=2.5 LONINC=3 Example 4: Superimpose a latitude/longitude graticule within a subarea of an image (full latitude and longitude extent), with a grid line drawn every 2.5 degrees between latitudes -8 and -1 degrees and only between longitudes 140 and 145 degrees: MODE=GROUND BASELAT=0 BASELON=0 LATINC=2.5 LONINC=2.5 MINLAT=-8 MAXLAT=-1 MINLON=140 MAXLON=145 Bound=yes For complex grids, the grid application can be run multiple times with different parameter settings for each successive run that builds onto the previous output file. The TICKS option can be used to draw short ticks instead of grid lines. The OUTLINE option will draw grid lines along the outside edges of the first and last samples and lines of the input file. The BOUNDARY option will either draw grid lines around the outside edges of the input file or around the bounding box specified by the user with MINLAT, MAXLAT, MINLON, and MAXLON parameters. CategoriesRelated Objects and DocumentsApplicationsHistory
|
Parameter GroupsFiles
Grid Type
Image Grid Parameters
Ground Grid Parameters
Ground Grid Limits
Line Parameters
Background Type
Tick Parameters
|
Files: FROM
Description
Use this parameter to select the input file.
| Type | cube |
|---|---|
| File Mode | input |
| Filter | *.cub |
Files: TO
Description
This file will contain the gridded image.
| Type | cube |
|---|---|
| File Mode | output |
| Filter | *.cub |
Grid Type: MODE
Description
This allows for selection of either IMAGE or GROUND coordinates when drawing the grid.
| Type | string | |||||||||
|---|---|---|---|---|---|---|---|---|---|---|
| Default | GROUND | |||||||||
| Option List: |
|
Grid Type: TICKS
Description
Draw ticks at grid line intersections (instead of drawing full lines).
| Type | boolean |
|---|---|
| Default | false |
| Inclusions |
|
Grid Type: OUTLINE
Description
This will draw grid lines at the very edges of the image.
| Type | boolean |
|---|---|
| Default | false |
Grid Type: BOUNDARY
Description
This will draw grid lines (or ticks) at the lat/lon extents of the image or those extents as provided by user input MINLAT, MAXLAT, MINLON, and MAXLON.
| Type | boolean |
|---|---|
| Default | false |
Grid Type: EXTENDGRID
Description
If false, the grid will stop at the longitude domain boundary, -180 to 180 or 0 to 360, if the minimum or maximum longitude values are outside of the domain range. If true, the grid will extend all the way to the minimum and maximum longitudes regardless of the domain.
| Type | boolean |
|---|---|
| Default | false |
Image Grid Parameters: BASELINE
Description
Starting line of grid. This, along with BASESAMPLE, defines the starting point (line) for drawing the grid.
| Type | integer |
|---|---|
| Default | 1 |
| Minimum | 1 (inclusive) |
Image Grid Parameters: BASESAMPLE
Description
Starting sample of grid. This, along with BASELINE, defines the starting point (sample) for drawing the grid.
| Type | integer |
|---|---|
| Default | 1 |
| Minimum | 1 (inclusive) |
Image Grid Parameters: LINC
Description
This defines the line increment when drawing the grid, starting at BASELINE. The line increment is the spacing between lines.
| Type | integer |
|---|---|
| Default | 100 |
| Minimum | 1 (inclusive) |
Image Grid Parameters: SINC
Description
This defines the sample increment when drawing the grid, starting at BASESAMPLE. The sample increment is the spacing between samples.
| Type | integer |
|---|---|
| Default | 100 |
| Minimum | 1 (inclusive) |
Ground Grid Parameters: BASELAT
Description
This is the latitude on which LATINC is mathematically based. This establishes a starting point for a global 'virtual' grid where latitude lines are drawn where the input image intersects the virtual grid. The application assumes user input reflects proper units (e.g. planetographic, planetocentric latitude) as defined within the image.
| Type | double |
|---|---|
| Default | 0.0 |
| Minimum | -90.0 (inclusive) |
Ground Grid Parameters: BASELON
Description
This is the longitude on which LONINC is mathematically based. This establishes a starting point for a global 'virtual' grid where longitude lines are drawn where the input image intersects the virtual grid.
| Type | double |
|---|---|
| Default | 0.0 |
| Minimum | -360.0 (inclusive) |
Ground Grid Parameters: LATINC
Description
This defines the latitude increment, based on BASELAT, on which grid lines are drawn. This establishes a global 'virtual' grid where latitude lines are drawn only where the input image intersects the virtual grid.
| Type | double |
|---|---|
| Default | 10.0 |
| Minimum | 0.0 (inclusive) |
Ground Grid Parameters: LONINC
Description
This defines the longitude increment, based on BASELON, on which grid lines are drawn. This establishes a global 'virtual' grid where longitude lines are drawn only where the input image intersects the virtual grid.
| Type | double |
|---|---|
| Default | 10.0 |
| Minimum | 0.0 (inclusive) |
Ground Grid Limits: MINLAT
Description
This defines the minimum latitude to which longitude grid lines will extend. If BOUNDARY is selected, a latitude line will be drawn at this latitude.
| Type | double |
|---|---|
| Internal Default | Automatic |
| Minimum | -90 (inclusive) |
| Maximum | 90 (inclusive) |
Ground Grid Limits: MAXLAT
Description
This defines the maximum latitude to which longitude grid lines will extend. If BOUNDARY is selected, a latitude line will be drawn at this latitude.
| Type | double |
|---|---|
| Internal Default | Automatic |
| Minimum | -90 (inclusive) |
| Maximum | 90 (inclusive) |
| Greater Than | MINLAT |
Ground Grid Limits: MINLON
Description
This defines the minimum longitude to which latitude grid lines will extend. If BOUNDARY is selected, a longitude line will be drawn at this longitude.
| Type | double |
|---|---|
| Internal Default | Automatic |
| Minimum | -360 (inclusive) |
| Maximum | 360 (inclusive) |
Ground Grid Limits: MAXLON
Description
This defines the maximum longitude to which latitude grid lines will extend. If BOUNDARY is selected, a longitude line will be drawn at this longitude.
| Type | double |
|---|---|
| Internal Default | Automatic |
| Minimum | -360 (inclusive) |
| Maximum | 360 (inclusive) |
| Greater Than | MINLON |
Line Parameters: LINEWIDTH
Description
This defines the thickness of grid lines in pixels.
| Type | integer |
|---|---|
| Default | 1 |
| Minimum | 1 (inclusive) |
| Odd | This value must be an odd number |
Line Parameters: LINEVALUE
Description
With this option choose DN, LRS, HRS, or NULL to define how to assign the grid line value. Use DNVALUE parameter to assign a number if DN option is chosen.
| Type | string | |||||||||||||||
|---|---|---|---|---|---|---|---|---|---|---|---|---|---|---|---|---|
| Default | HRS | |||||||||||||||
| Option List: |
|
Line Parameters: DNVALUE
Description
This is the DN value to be used as the value of the grid lines when LINEVALUE=DN. It is beneficial to first run the stats application to determine image minimum and maximum values.
| Type | double |
|---|
Background Type: BKGNDVALUE
Description
This option allows for any DN value, HRS, LRS, or NULL special pixel values to be chosen as the background value.
| Type | string | ||||||||||||||||||
|---|---|---|---|---|---|---|---|---|---|---|---|---|---|---|---|---|---|---|---|
| Default | IMAGE | ||||||||||||||||||
| Option List: |
|
Background Type: BKGNDDNVALUE
Description
This is the DN value to be used as the value of the background when BKGNDVALUE=DN. It may be beneficial to first run the stats application to determine image minimum and maximum values.
| Type | double |
|---|
Tick Parameters: DIAGONALTICKS
Description
Draw tick marks diagonally (creating an 'x'), instead of default vertical/horizontal ('+')
| Type | boolean |
|---|---|
| Default | false |
Tick Parameters: TICKSIZE
Description
This defines the width and height (which are always equal) of the tick marks in pixels.
| Type | integer |
|---|---|
| Default | 5 |
| Minimum | 1 (inclusive) |
| Odd | This value must be an odd number |
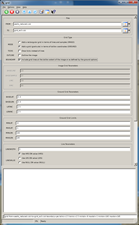
Example 1Basic latitude/longitude graticule Description
In this example, the latitude and longitude grid lines are drawn every 10
degrees starting at 0.0 degree latitude and longitude.
Command Line
grid
from=aeolis_reduced.cub to=grid_ex1.cub
Superimpose grid lines using default settings.
GUI Screenshot
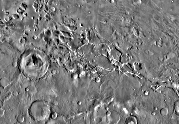
Input Image
Output Image
|
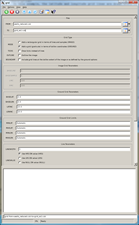

Example 2Simple rectangular grid Description
In this example, the grid lines are drawn based on the line and sample
coordinates entered by the user in IMAGE mode.
Command Line
grid
from=aeolis_reduced.cub to=grid_ex2.cub mode=image baseline=23 basesamp=17 sinc=30 linc=40
Superimpose grid lines using line and sample coordinates.
GUI Screenshot
Input Image
Output Image
|
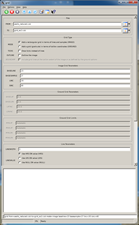

Example 3Insert a graticule within the input image Description
In this example, the grid lines are drawn based on a set of user-defined
values for the different latitude and longitude parameters. The graticule
is drawn only within the minimum and maximum latitude and longitude extents
entered by the user.
Command Line
grid
from=aeolis_reduced.cub to=grid_ex4.cub mode=ground baselat=0 baselon=0 latinc=2.5
loninc=2.5 minlat=-8 maxlat=-1 minlon=140 maxlon=145 bound=yes
Superimpose grid lines using 2.5 degrees latitude and longitude increments from an
origin (0,0) defined by the user. The outer edges of the graticule bounding box will be
gridded (BOUND=YES).
GUI Screenshot
Input Image
Output Images
|